
1. Moving the Markets
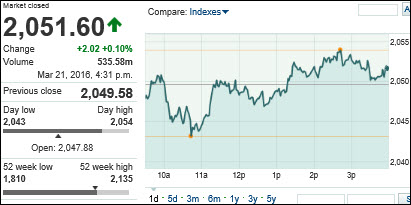
The resurgent U.S. stock market kicked off the holiday-shortened week by slightly extending last week’s gains as investors digested a big rally that has turned stocks positive for the year and reacted to deals in the hotel, paint and data businesses.
A flurry of M&A deals announced Monday gave an assist, including Starwood Hotels & Resorts Worldwide (HOT) agreeing to a better revised deal of $13.6 billion from Marriott International (MAR) that tops a competing bid from China’s Anbang Insurance Group.
Apple (AAPL) was back in the news today. The company unveiled the iPhone SE Monday, which executives described as “the most powerful 4-inch phone ever.” Hitting the market alongside the smaller phone was a trimmed down iPad Pro. The stock moved up and down, but ended at par with the morning.
I for one am very curious to see if the upward momentum of the recent bear market rally can continue as some of the supporting players are no longer in the game. First, most of the shorts have covered so that driving force has been diminished. Second, the biggest contributors to the recent ramp, namely corporate buy-backs, are entering their blackout period, which is the 5 week time frame prior to their quarterly reports cards being issued. Third, according to BofA, most institutional clients, AKA the smart money, took the recent rally as an opportunity to exit the markets or at least lighten up on equity positions.
If, however, against this negative backdrop, the markets continue on their upward trajectory, we may very well face a resumption of last year’s bull market, which may possibly coincide with a new Domestic Buy signal. You can see the latest numbers in section 3 below.
2. ETFs in the Spotlight
In case you missed the announcement and description of this section, you can read it here again.
It features 10 broadly diversified ETFs from my HighVolume list as posted every Monday. Furthermore, they are screened for the lowest MaxDD% number meaning they have been showing better resistance to temporary sell offs than all others over the past year.
Here are the 10 candidates:
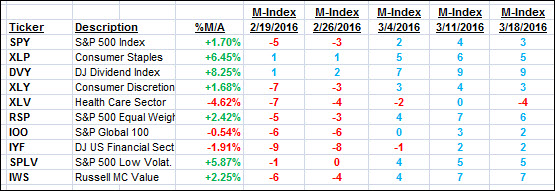
The above table simply demonstrates the magnitude with which some of the ETFs are fluctuating in regards to their positions above or below their respective individual trend lines (%M/A). A break below, represented by a negative number, shows weakness, while a break above, represented by a positive percentage, shows strength.
For hundreds of ETF/Mutual fund choices, be sure to reference Thursday’s StatSheet.
Year to date, here’s how the above candidates have fared so far:
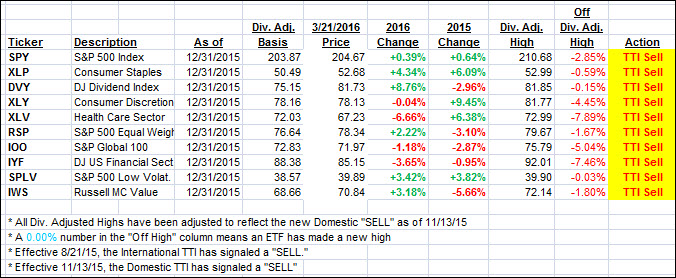
Again, the first table above shows the position of the various ETFs in relation to their respective long term trend lines (%M/A), while the second one tracks their trailing sell stops in the “Off High” column. The “Action” column will signal a “Sell” once the -7.5% point has been taken out in the “Off High” column.
3. Trend Tracking Indexes (TTIs)
Our Domestic Trend Tracking Index (TTI) changed only immaterially as the indexes showed no clear directional tendencies.
Here’s how we closed today:
Domestic TTI: +0.55% (last close +0.60%)—Sell signal effective 11/13/2015
International TTI: -2.88% (last close -2.67%)—Sell signal effective 8/21/2015
Disclosure: I am obliged to inform you that I, as well as advisory clients of mine, own some of these listed ETFs. Furthermore, they do not represent a specific investment recommendation for you, they merely show which ETFs from the universe I track are falling within the guidelines specified.
Contact Ulli