
1. Moving the Markets
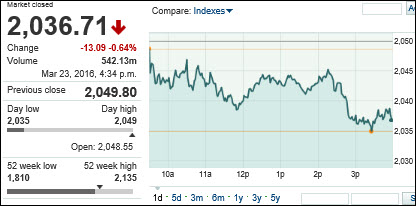
There wasn’t a lot of news for the markets to react to today, so reactionaries moved back to their fallback…oil prices. Oil prices were down more than 3% after the U.S. government reported a crude build three times above analysts’ expectations.
Virgin America stole a number of headlines today after news reports stated that the company is considering selling a part or its entire business. Virgin America’s shares gained 13.7% to $34.87. Virgin America is the U.S. offshoot of billionaire entrepreneur Richard Branson’s London-based Virgin Group, which is involved in airlines, railroads, telecommunications, media and hospitality.
Stocks that moved lower today included Sun Edison, Nike after reporting lower-than-expected revenue, and ConocoPhillips. The energy company slid along with the rest of the sector after reports of growing U.S. stockpiles.
Looking ahead for the week, we will get a read on durable goods for February. Analysts are expecting a 3% drop for new orders. Fed watch continues with St. Louis Fed President James Bullard speaking in New York and pre-orders begin for Apple’s new iPhone SE smartphone, its cheapest iPhone to date.
2. ETFs in the Spotlight
In case you missed the announcement and description of this section, you can read it here again.
It features 10 broadly diversified ETFs from my HighVolume list as posted every Monday. Furthermore, they are screened for the lowest MaxDD% number meaning they have been showing better resistance to temporary sell offs than all others over the past year.
Here are the 10 candidates:
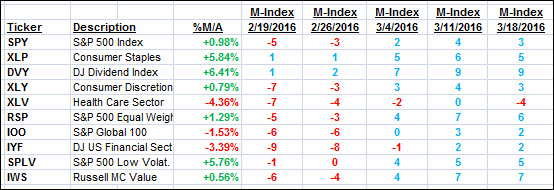
The above table simply demonstrates the magnitude with which some of the ETFs are fluctuating in regards to their positions above or below their respective individual trend lines (%M/A). A break below, represented by a negative number, shows weakness, while a break above, represented by a positive percentage, shows strength.
For hundreds of ETF/Mutual fund choices, be sure to reference Thursday’s StatSheet.
Year to date, here’s how the above candidates have fared so far:
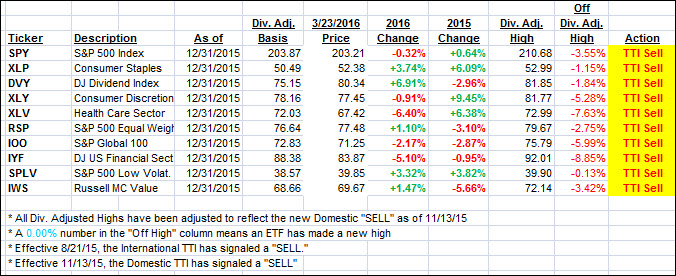
Again, the first table above shows the position of the various ETFs in relation to their respective long term trend lines (%M/A), while the second one tracks their trailing sell stops in the “Off High” column. The “Action” column will signal a “Sell” once the -7.5% point has been taken out in the “Off High” column.
3. Trend Tracking Indexes (TTIs)
Our Domestic Trend Tracking Index (TTI) slipped as the major indexes pulled back a tad.
Here’s how we closed:
Domestic TTI: +0.28% (last close +0.49%)—Sell signal effective 11/13/2015
International TTI: -3.51% (last close -2.79%)—Sell signal effective 8/21/2015
Disclosure: I am obliged to inform you that I, as well as advisory clients of mine, own some of these listed ETFs. Furthermore, they do not represent a specific investment recommendation for you, they merely show which ETFs from the universe I track are falling within the guidelines specified.
Contact Ulli