
1. Moving the Markets
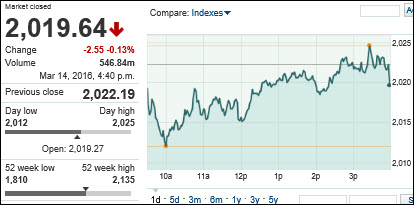
The Dow, which is looking to extend its weekly winning streak to five, traded slightly higher as investors looked ahead to a key Fed meeting on interest rates later this week.
We have a big week ahead of us. The Federal Reserve meets Tuesday and Wednesday and Wall Street will be closely monitoring its policy statement on Wednesday to see if they raise interest rates or if they plan to in the near future.
It was a strange day in that crude oil got clobbered and lost over 3.5% while equities decoupled and held firm. The S&P 500 is now bouncing around its 200-day moving average and it remains to be seen whether this level can be conquered or act as glass ceiling. If the S&P 500 breaks through to the upside, major resistance will come in around the 2,045 mark, a level which might coincide with a new potential Domestic Buy signal.
So far, this rally is still considered a bear market rebound, and it’s questionable whether it will have enough legs to push back into bull market territory. But, as we’ve seen in the recent past, all it takes is some headline hockey to cause the computer driven algos to push the indexes higher regardless of underlying fundamental realities.
One well-known hedge fund manager put it this way: The upside is maybe 2% while the downside is 20%. We’ll have to wait and see if he’s right.
2. ETFs in the Spotlight
In case you missed the announcement and description of this section, you can read it here again.
It features 10 broadly diversified ETFs from my HighVolume list as posted every Monday. Furthermore, they are screened for the lowest MaxDD% number meaning they have been showing better resistance to temporary sell offs than all others over the past year.
Here are the 10 candidates:
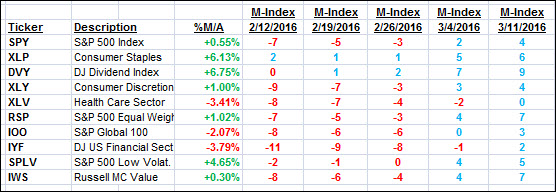
The above table simply demonstrates the magnitude with which some of the ETFs are fluctuating in regards to their positions above or below their respective individual trend lines (%M/A). A break below, represented by a negative number, shows weakness, while a break above, represented by a positive percentage, shows strength.
For hundreds of ETF/Mutual fund choices, be sure to reference Thursday’s StatSheet.
Year to date, here’s how the above candidates have fared so far:
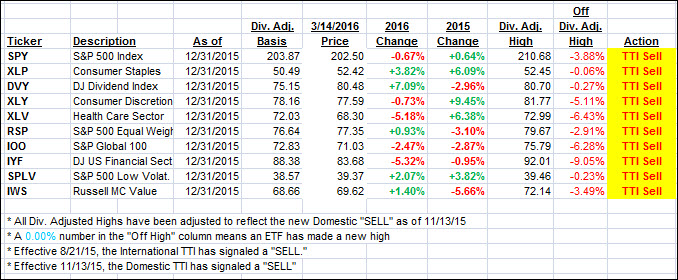
Again, the first table above shows the position of the various ETFs in relation to their respective long term trend lines (%M/A), while the second one tracks their trailing sell stops in the “Off High” column. The “Action” column will signal a “Sell” once the -7.5% point has been taken out in the “Off High” column.
3. Trend Tracking Indexes (TTIs)
Our Domestic Trend Tracking Index (TTI) stayed unchanged as the major indexes went predominantly sideways.
Here’s how we ended up:
Domestic TTI: -0.20% (last close -0.20%)—Sell signal effective 11/13/2015
International TTI: -3.72% (last close -3.64%)—Sell signal effective 8/21/2015
Disclosure: I am obliged to inform you that I, as well as advisory clients of mine, own some of these listed ETFs. Furthermore, they do not represent a specific investment recommendation for you, they merely show which ETFs from the universe I track are falling within the guidelines specified.
Contact Ulli