
1. Moving the Markets
U.S. stocks rallied modestly after the Federal Reserve left interest rates unchanged and signaled more gradual increases.Wall Street had expected the Fed to keep rates unchanged, but wanted clues as to the timing of the Fed’s next rate increase. The Fed lowered its plan to possibly two more hikes this year, down from four, for a total increase of 50 basis points, which is much more aligned with Wall Street analysts’ expectations.
Stocks have been in rally mode since mid-February, driven in part by corporate buy-backs, rebounding oil prices and a belief that the Fed may not be as aggressive with rate hikes as originally believed following early-year financial market turbulence and slowing growth abroad.
The recent oil price rally raised hopes among producers that the worst may be over when it comes to the slump that has persisted for 14 months now. Personally, I don’t think we’ve seen the lows for the year yet.
As a result, after months of torturous declines, energy stocks have been making a comeback as oil prices rallied from an oversold condition not unlike the stock market. The 40 energy stocks in the Standard & Poor’s 500, including Exxon Mobil (XOM), exploration company Range Resources (RRC) and pipeline company Kinder Morgan(KMI), have put $209 billion back into the pockets of investors since oil prices hit rock bottom on Jan. 20. Let’s see how long this rebound can last in the face of overproduction, slowing global demand and storage facilities that are close to reaching their limit.
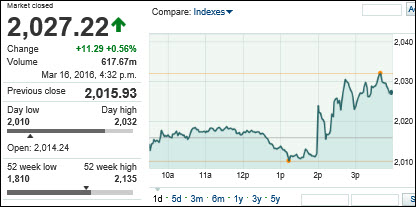
With today’s rebound, our Domestic Trend Tracking Index (TTI) touched its long-term trend line. Please see section 3 below for details.
2. ETFs in the Spotlight
In case you missed the announcement and description of this section, you can read it here again.
It features 10 broadly diversified ETFs from my HighVolume list as posted every Monday. Furthermore, they are screened for the lowest MaxDD% number meaning they have been showing better resistance to temporary sell offs than all others over the past year.
Here are the 10 candidates:
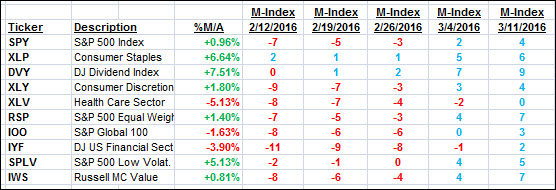
The above table simply demonstrates the magnitude with which some of the ETFs are fluctuating in regards to their positions above or below their respective individual trend lines (%M/A). A break below, represented by a negative number, shows weakness, while a break above, represented by a positive percentage, shows strength.
For hundreds of ETF/Mutual fund choices, be sure to reference Thursday’s StatSheet.
Year to date, here’s how the above candidates have fared so far:
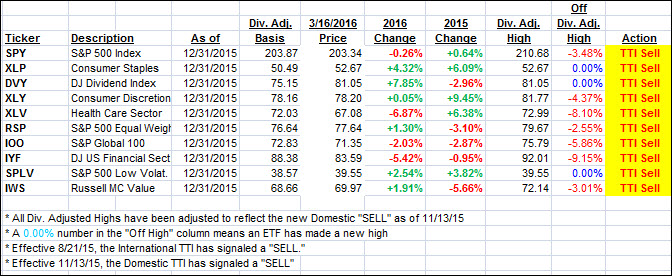
Again, the first table above shows the position of the various ETFs in relation to their respective long term trend lines (%M/A), while the second one tracks their trailing sell stops in the “Off High” column. The “Action” column will signal a “Sell” once the -7.5% point has been taken out in the “Off High” column.
3. Trend Tracking Indexes (TTIs)
Our Domestic Trend Tracking Index (TTI) edged higher and touched its long-term trend line for the first time since December last year. As I have repeatedly posted, I want to see a clear piercing to the upside by some 1% along with some staying power, before I consider this bearish trend to be over.
Stay tuned, since a new Domestic Buy signal may be in our near future.
Here’s how we closed:
Domestic TTI: +0.01% (last close -0.39%)—Sell signal effective 11/13/2015
International TTI: -3.81% (last close -4.40%)—Sell signal effective 8/21/2015
Disclosure: I am obliged to inform you that I, as well as advisory clients of mine, own some of these listed ETFs. Furthermore, they do not represent a specific investment recommendation for you, they merely show which ETFs from the universe I track are falling within the guidelines specified.
Contact Ulli