
1. Moving the Markets
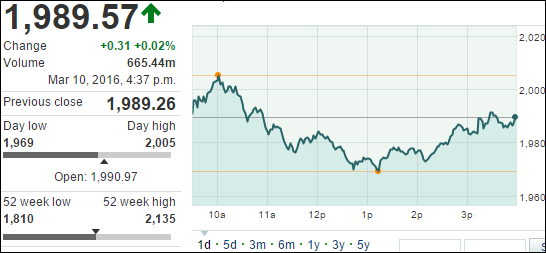
There was a lot of movement in the markets today that only resulted in minimal changes at the closing bell. Markets stayed flat after a roller coaster ride of reactions to reports from the ECB and decisions regarding oil.
Lots of buzz about the European Union today! News came in that the European Central Bank cut its deposit rate further into negative territory, expanded its bond-buying program and lowered the benchmark refinancing rate to zero. The bank cut its deposit rate to -0.4% from -0.3% and the main refinancing rate was cut by 5 points to 0%, at a meeting in Frankfurt.
Wall Street is still hoping the ECB will deliver on its promises to inject fresh stimulus into the ailing eurozone economy and spark a much-needed rise in dangerously low inflation. For the time being, the positive market reaction in Europe lasted about 15 minutes before the indexes tanked with the German DAX vacillating intra-day over 5%.
Crude oil declined on reports a meeting between major oil producers set for March 20 was unlikely to happen.
In the domestic economy, jobless claims offered a boost of optimism for investors as they fell to a five-month low of 259,000, suggesting layoffs are shrinking and the minimum wage labor market is on a steady footing.
2. ETFs in the Spotlight
In case you missed the announcement and description of this section, you can read it here again.
It features 10 broadly diversified ETFs from my HighVolume list as posted every Monday. Furthermore, they are screened for the lowest MaxDD% number meaning they have been showing better resistance to temporary sell offs than all others over the past year.
Here are the 10 candidates:
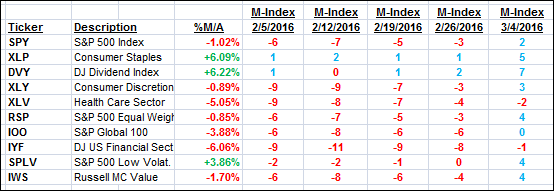
The above table simply demonstrates the magnitude with which some of the ETFs are fluctuating in regards to their positions above or below their respective individual trend lines (%M/A). A break below, represented by a negative number, shows weakness, while a break above, represented by a positive percentage, shows strength.
For hundreds of ETF/Mutual fund choices, be sure to reference Thursday’s StatSheet.
Year to date, here’s how the above candidates have fared so far:
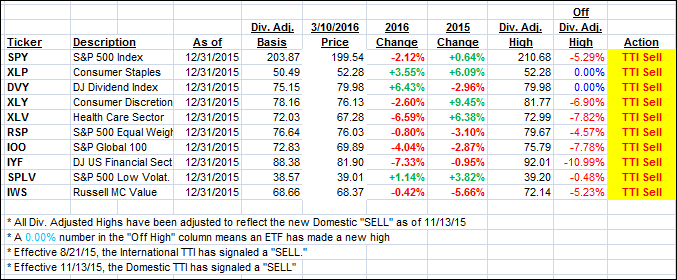
Again, the first table above shows the position of the various ETFs in relation to their respective long term trend lines (%M/A), while the second one tracks their trailing sell stops in the “Off High” column. The “Action” column will signal a “Sell” once the -7.5% point has been taken out in the “Off High” column.
3. Trend Tracking Indexes (TTIs)
Our Domestic Trend Tracking Index (TTI) changed again only slightly with no effect on our current bearish stance.
Here’s how we ended up:
Domestic TTI: -0.80% (last close -0.68%)—Sell signal effective 11/13/2015
International TTI: -5.69% (last close -5.58%)—Sell signal effective 8/21/2015
Disclosure: I am obliged to inform you that I, as well as advisory clients of mine, own some of these listed ETFs. Furthermore, they do not represent a specific investment recommendation for you, they merely show which ETFs from the universe I track are falling within the guidelines specified.
Contact Ulli