
1. Moving the Markets
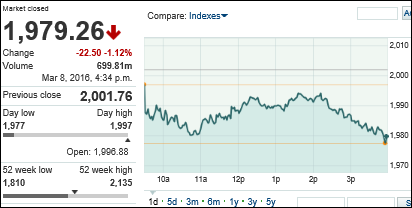
Yesterday, I pointed out that investors would be closely watching a slew of economic data this week, one piece of which was China’s trade numbers. Well, the numbers came in today and were disappointing to say the least.
Imports fell 13% and exports dropped a whopping 25%. That is a big number and Wall Street reacted accordingly and all 3 major indexes closed in negative territory. The weak data point reminded investors that the slowdown in the world’s second biggest economy remains an issue for global growth.
In the oil and gas world, we Chevron Corp (CVXN) said today that the company will cut its budget by at least 17% for the next two years. The reason being is to save money given that crude prices sit near 10-year lows.
While oil made a slight comeback over the past 2-3 weeks, it seems that it was just a fluke, as reality took over and the black gold moved back to about $36 a barrel today.
2. ETFs in the Spotlight
In case you missed the announcement and description of this section, you can read it here again.
It features 10 broadly diversified ETFs from my HighVolume list as posted every Monday. Furthermore, they are screened for the lowest MaxDD% number meaning they have been showing better resistance to temporary sell offs than all others over the past year.
Here are the 10 candidates:
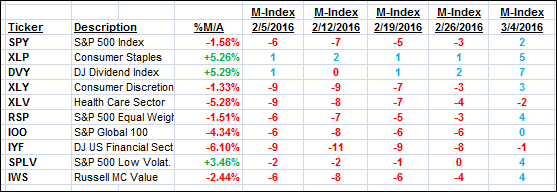
The above table simply demonstrates the magnitude with which some of the ETFs are fluctuating in regards to their positions above or below their respective individual trend lines (%M/A). A break below, represented by a negative number, shows weakness, while a break above, represented by a positive percentage, shows strength.
For hundreds of ETF/Mutual fund choices, be sure to reference Thursday’s StatSheet.
Year to date, here’s how the above candidates have fared so far:
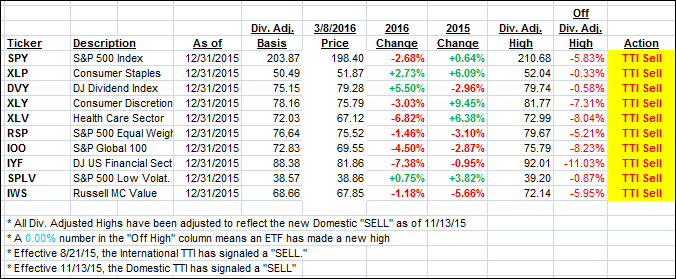
Again, the first table above shows the position of the various ETFs in relation to their respective long term trend lines (%M/A), while the second one tracks their trailing sell stops in the “Off High” column. The “Action” column will signal a “Sell” once the -7.5% point has been taken out in the “Off High” column.
3. Trend Tracking Indexes (TTIs)
Our Domestic Trend Tracking Index (TTI) slipped further into bearish territory and closed the day as follows:
Domestic TTI: -0.80% (last close -0.46%)—Sell signal effective 11/13/2015
International TTI: -5.76% (last close -4.52%)—Sell signal effective 8/21/2015
Disclosure: I am obliged to inform you that I, as well as advisory clients of mine, own some of these listed ETFs. Furthermore, they do not represent a specific investment recommendation for you, they merely show which ETFs from the universe I track are falling within the guidelines specified.
Contact Ulli