
1. Moving the Markets
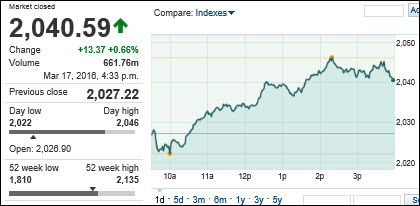
Another rally in crude oil prices boosted energy, while residual goodwill after a dovish Federal Reserve meeting powered broader markets higher. Early in the day, the Dow Jones industrial average crossed into positive territory for the first time this year and stayed there, capping a remarkable comeback from Wall Street’s worst ever start to a year. The buying wave continued and, this afternoon, the S&P 500 index also crossed into positive territory for the first time this year.
Adding to the enthusiasm was the news that the Fed lowered its plan to two more quarter-point hikes this year, down from the four it had predicted previously. The new plan was more aligned with Wall Street analysts’ expectations. On the other hand, it’s a sad day to realize that the Fed considers economic conditions so deplorable that they’re fearful to even implement a meager 0.25% interest rate hike in an effort to finally get on track in normalizing rates.
Shares of Williams Sonoma (WSM) slid today after the company released disappointing sales and earnings figures for the holiday season. The wholesale retailer suffered a drop in both same-store and e-commerce sales at their key client Pottery Barn. Shares dropped 6.26%.
In corporate and economic news: Applications for unemployment benefits rose slightly last week, the Labor Department reported, but they remain at levels consistent with a healthy job market. Weekly jobless claims rose by 7,000 to a seasonally adjusted 265,000.
2. ETFs in the Spotlight
In case you missed the announcement and description of this section, you can read it here again.
It features 10 broadly diversified ETFs from my HighVolume list as posted every Monday. Furthermore, they are screened for the lowest MaxDD% number meaning they have been showing better resistance to temporary sell offs than all others over the past year.
Here are the 10 candidates:
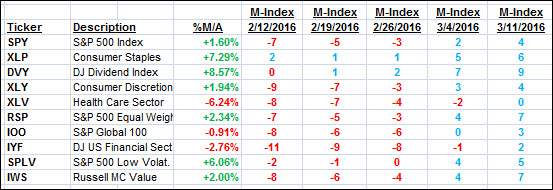
The above table simply demonstrates the magnitude with which some of the ETFs are fluctuating in regards to their positions above or below their respective individual trend lines (%M/A). A break below, represented by a negative number, shows weakness, while a break above, represented by a positive percentage, shows strength.
For hundreds of ETF/Mutual fund choices, be sure to reference Thursday’s StatSheet.
Year to date, here’s how the above candidates have fared so far:
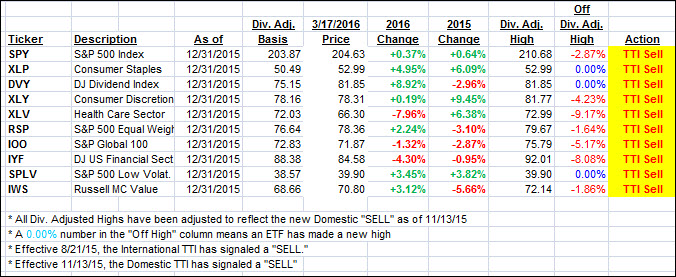
Again, the first table above shows the position of the various ETFs in relation to their respective long term trend lines (%M/A), while the second one tracks their trailing sell stops in the “Off High” column. The “Action” column will signal a “Sell” once the -7.5% point has been taken out in the “Off High” column.
3. Trend Tracking Indexes (TTIs)
Our Domestic Trend Tracking Index (TTI) followd the indexes higher and closed slightly above its long-term trend line for the second day.
Here are the conditions necessary for me to issue a new Domestic Buy signal: I want to see a clear piercing to the upside by some 1% along with some staying power, before I consider the current bearish trend to be over.
Here’s how we closed:
Domestic TTI: +0.29% (last close +0.01%)—Sell signal effective 11/13/2015
International TTI: -3.15% (last close -3.81%)—Sell signal effective 8/21/2015
Disclosure: I am obliged to inform you that I, as well as advisory clients of mine, own some of these listed ETFs. Furthermore, they do not represent a specific investment recommendation for you, they merely show which ETFs from the universe I track are falling within the guidelines specified.
Contact Ulli