
1. Moving the Markets
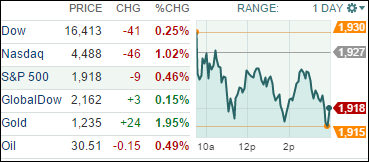
Stocks fell, capping the Dow’s winning streak at three days as continued volatility in oil prices was offset by a lowered sales outlook from retail giant and Dow component Walmart.
For the past three sessions, the market has been volatile like it has been for most of 2016. The only difference is the recent wild swings have been to the upside, with the Dow enjoying gains of 314, 223 and 257 points the past three sessions since hitting a bottom last Thursday. For the S&P 500 there is overhead resistance lurking around the 1,950 area, so we’ll have to wait and see if this glass ceiling holds and acts as a reversal point or if we’re able to break through it.
Some have called this rebound a “garbage” stock market rally as fundamentals are not in sync with higher prices and predominantly short covering, which I have alluded to, has produced the power for this upswing. Only time will tell if this was one big head fake or the resumption of the bullish trend.
2. ETFs in the Spotlight
In case you missed the announcement and description of this section, you can read it here again.
It features 10 broadly diversified ETFs from my HighVolume list as posted every Monday. Furthermore, they are screened for the lowest MaxDD% number meaning they have been showing better resistance to temporary sell offs than all others over the past year.
Here are the 10 candidates:
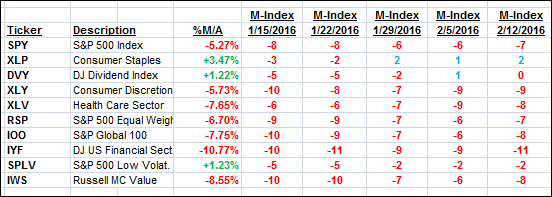
The above table simply demonstrates the magnitude with which some of the ETFs are fluctuating in regards to their positions above or below their respective individual trend lines (%M/A). A break below, represented by a negative number, shows weakness, while a break above, represented by a positive percentage, shows strength.
For hundreds of ETF/Mutual fund choices, be sure to reference Thursday’s StatSheet.
Year to date, here’s how the above candidates have fared so far:
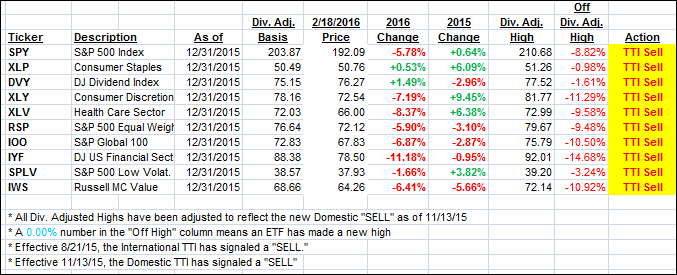
Again, the first table above shows the position of the various ETFs in relation to their respective long term trend lines (%M/A), while the second one tracks their trailing sell stops in the “Off High” column. The “Action” column will signal a “Sell” once the -7.5% point has been taken out in the “Off High” column.
3. Trend Tracking Indexes (TTIs)
Our Domestic Trend Tracking Index (TTI) slipped just a tad as the major indexes pulled back.
Here’s how we ended up:
Domestic TTI: -2.20% (last close -1.96%)—Sell signal effective 11/13/2015
International TTI: -9.35% (close -9.14%)—Sell signal effective 8/21/2015
Disclosure: I am obliged to inform you that I, as well as advisory clients of mine, own some of these listed ETFs. Furthermore, they do not represent a specific investment recommendation for you, they merely show which ETFs from the universe I track are falling within the guidelines specified.
Contact Ulli