
1. Moving the Markets
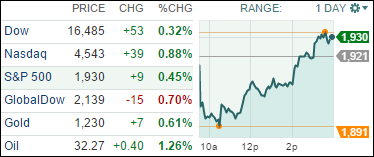
Stocks pulled out of an early deep slide to close higher as the common “follow the leader” trend that has dominated Wall Street for most of 2016 came back in play: The direction of oil prices determines the direction of stocks.
The “disappointing” sentiment that oil production caps would not come into play seemed to turn around today, when news of a smaller-than-expected build in crude inventories last week caused the price of oil to go from a loss of nearly 4% to a gain of 1.3%. Stocks followed in suit despite some horrific economic data showing that home sales were the worst in some 2 years and the Services industry was the worst in 3 years. Go figure…
Also impacting market sentiment on Wall Street early Wednesday were comments after Tuesday’s market close from Federal Reserve vice chairman Stanley Fischer. In a speech, Fischer did not rule out an interest rate hike from the Federal Reserve at its meeting next month. “We simply do not know” if (the Fed) will increase borrowing costs in March, he said.
Given that bad news is good news again, anything can happen as we’ve seen today with the Dow rallying over 300 points off the bottom. One of these days, reality about not just domestic but also deteriorating global economic conditions will set in causing rebound attempts to fail miserably leaving the bears in charge. In my view, this is not the time to be a hero and engage in bottom fishing.
2. ETFs in the Spotlight
In case you missed the announcement and description of this section, you can read it here again.
It features 10 broadly diversified ETFs from my HighVolume list as posted every Monday. Furthermore, they are screened for the lowest MaxDD% number meaning they have been showing better resistance to temporary sell offs than all others over the past year.
Here are the 10 candidates:
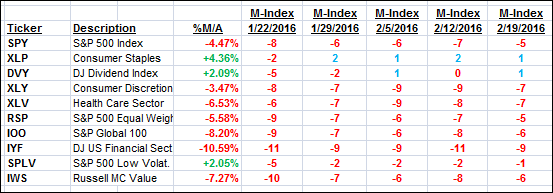
The above table simply demonstrates the magnitude with which some of the ETFs are fluctuating in regards to their positions above or below their respective individual trend lines (%M/A). A break below, represented by a negative number, shows weakness, while a break above, represented by a positive percentage, shows strength.
For hundreds of ETF/Mutual fund choices, be sure to reference Thursday’s StatSheet.
Year to date, here’s how the above candidates have fared so far:
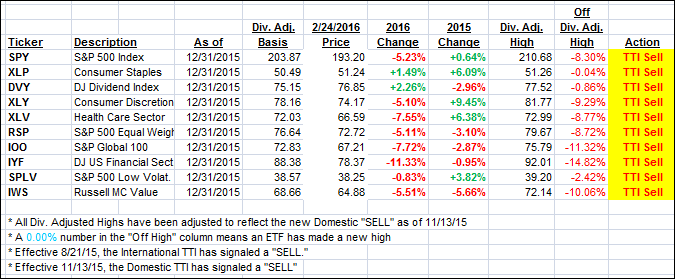
Again, the first table above shows the position of the various ETFs in relation to their respective long term trend lines (%M/A), while the second one tracks their trailing sell stops in the “Off High” column. The “Action” column will signal a “Sell” once the -7.5% point has been taken out in the “Off High” column.
3. Trend Tracking Indexes (TTIs)
Our Domestic Trend Tracking Index (TTI) changed only slightly as the major stock indexes managed to crawl out of a deep hole to close above the unchaged line:
Here are today’s closing numbers:
Domestic TTI: -1.71% (last close -1.90 %)—Sell signal effective 11/13/2015
International TTI: -9.52% (last close -9.27%)—Sell signal effective 8/21/2015
Disclosure: I am obliged to inform you that I, as well as advisory clients of mine, own some of these listed ETFs. Furthermore, they do not represent a specific investment recommendation for you, they merely show which ETFs from the universe I track are falling within the guidelines specified.
Contact Ulli