
1. Moving the Markets
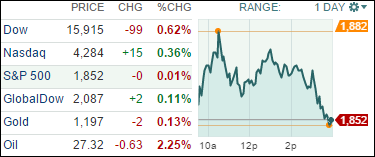
There was much hope of the Fed showing signs of not only relenting from their planned interest rate hikes in 2016 but possibly shifting in reverse and lowering rates in the very near future.
Such was the anticipation as Fed chief Yellen delivered testimony in front of a congressional committee, which also had the opportunity to participate in a Q&A session. While equities displayed some exuberance early on, the major indexes slid in the afternoon as it became clear that no assist to push stocks out of their doldrums was forthcoming.
Yellen said that financial conditions “have become less supportive to growth” and “downside risks” are largely stemming from uncertainty over the state of the Chinese economy. In the end, Yellen left the door wide open as to further rate increases in 2016. To me, that means that equities have to find another driver to push prices higher as the Fed, at least for the time being, is not showing an accommodative stance.
With the markets ending basically unchanged, only 3 of our 10 ETFs in the Spotlight made a dash above the unchanged line led by Healthcare (XLV) with +0.87%. On the downside, the Select Dividend ETF (DVY) lost -0.38%.
2. ETFs in the Spotlight
In case you missed the announcement and description of this section, you can read it here again.
It features 10 broadly diversified ETFs from my HighVolume list as posted every Monday. Furthermore, they are screened for the lowest MaxDD% number meaning they have been showing better resistance to temporary sell offs than all others over the past year.
Here are the 10 candidates:
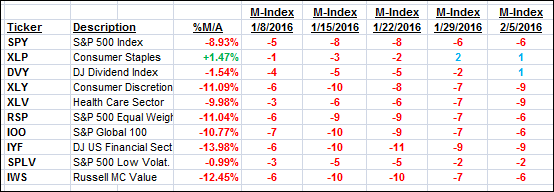
The above table simply demonstrates the magnitude with which some of the ETFs are fluctuating in regards to their positions above or below their respective individual trend lines (%M/A). A break below, represented by a negative number, shows weakness, while a break above, represented by a positive percentage, shows strength.
For hundreds of ETF/Mutual fund choices, be sure to reference Thursday’s StatSheet.
Year to date, here’s how the above candidates have fared so far:
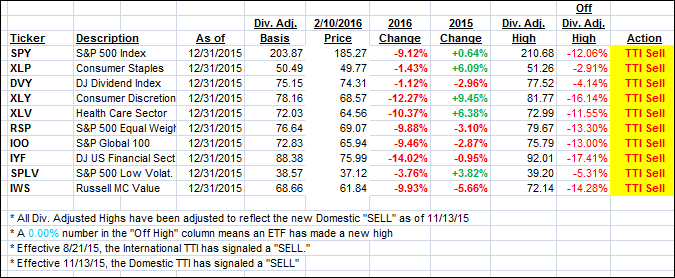
Again, the first table above shows the position of the various ETFs in relation to their respective long term trend lines (%M/A), while the second one tracks their trailing sell stops in the “Off High” column. The “Action” column will signal a “Sell” once the -7.5% point has been taken out in the “Off High” column.
3. Trend Tracking Indexes (TTIs)
In a repeat from yesterday, our Domestic Trend Tracking Index (TTI) harldy changed during this directionless session.
Here’s how we ended up:
Domestic TTI: -3.54% (last close -3.64%)—Sell signal effective 11/13/2015
International TTI: -12.67% (last close -13.03%)—Sell signal effective 8/21/2015
Disclosure: I am obliged to inform you that I, as well as advisory clients of mine, own some of these listed ETFs. Furthermore, they do not represent a specific investment recommendation for you, they merely show which ETFs from the universe I track are falling within the guidelines specified.
Contact Ulli