
1. Moving the Markets
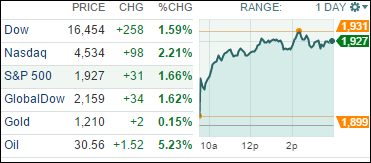
At its low point just a few days ago, the Dow was down about 1,800 points (or 10%) for the year. However, over the past three trading sessions, it has regained over 750 points. Whether the rally marks the end of a painful correction is still to be determined though.
One of the big movers continues to be crude oil. The recent news of a potential cap proposed by Saudi Arabia, Russia and other nations has given a lift to oil prices. And while there’s no guarantee that a deal will be sealed, it is still a sign that the recent oil crash could now be playing out in favor of the markets.
It is all adding up to nothing but a “relief rally” that has slashed the Dow’s losses in half this year. And if the trend continues the bearish spell over on Wall Street may be limited, although I doubt it. If this all very confusing to you, ZH explained it this way:
So let’s get this straight. Russia and OPEC ‘agree’ to consider (not actually act upon) “freezing” production levels (at current record high levels) and the market plunges amid disappointment over no cuts. And today WTI spikes and erases all those losses as Iran supports the “freeze” plan but will not cut its own production plans…
Go figure! As I have mentioned before, these types of sharp rebounds preceded by jaw dropping sell-offs are typical of bear markets. Until the long-term trend line of our Domestic TTI, see section 3 below, is crossed to the upside, these moves are meaningless other than to instill hope for those stuck in losing long positions that the bulls are finally in charge again.
2. ETFs in the Spotlight
In case you missed the announcement and description of this section, you can read it here again.
It features 10 broadly diversified ETFs from my HighVolume list as posted every Monday. Furthermore, they are screened for the lowest MaxDD% number meaning they have been showing better resistance to temporary sell offs than all others over the past year.
Here are the 10 candidates:
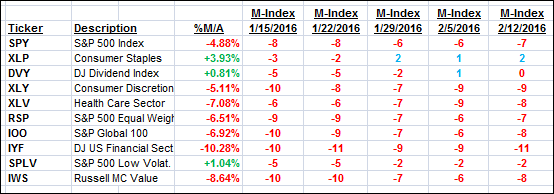
The above table simply demonstrates the magnitude with which some of the ETFs are fluctuating in regards to their positions above or below their respective individual trend lines (%M/A). A break below, represented by a negative number, shows weakness, while a break above, represented by a positive percentage, shows strength.
For hundreds of ETF/Mutual fund choices, be sure to reference Thursday’s StatSheet.
Year to date, here’s how the above candidates have fared so far:
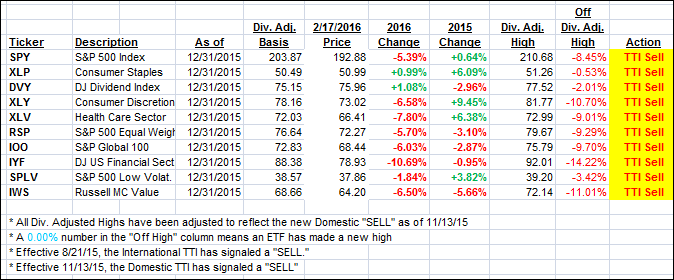
Again, the first table above shows the position of the various ETFs in relation to their respective long term trend lines (%M/A), while the second one tracks their trailing sell stops in the “Off High” column. The “Action” column will signal a “Sell” once the -7.5% point has been taken out in the “Off High” column.
3. Trend Tracking Indexes (TTIs)
Our Domestic Trend Tracking Index (TTI) improved again as the rebound continued. Nevertheless, we remain clearly in bearish territory with the day closing as follows:
Domestic TTI: -1.96% (last close -2.58%)—Sell signal effective 11/13/2015
International TTI: -9.14% (close -10.65%)—Sell signal effective 8/21/2015
Disclosure: I am obliged to inform you that I, as well as advisory clients of mine, own some of these listed ETFs. Furthermore, they do not represent a specific investment recommendation for you, they merely show which ETFs from the universe I track are falling within the guidelines specified.
Contact Ulli