
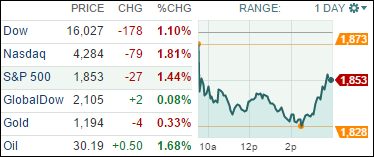
1. Moving the Markets
It it hadn’t been for a last hour turn-around, possibly a dead cat bounce, the major indexes may have headed for a steep dive. As it turned out, the worst was avoided for the time being, but this type of market action underscores what I have been saying since the middle of November—when our Domestic TTI broke below its long-term trend line—that a bear market has started and the only unknown is its magnitude and duration.
On the heels of Friday’s sell-off, the culprits remain the same in that crude oil continued its southerly path, European banks, especially Deutsche Bank, are in “fear” mode and, of course, the global economic slowdown has become all too real now.
Besides the Material Sector (-2.7%), Financials took a beating at the tune of -2.6%, however, energy was fairly resilient and closed up +0.1%. While the S&P 500 closed below its January closing low (1,859), it still remains above its January intra-day low of 1,812 which, once taken out will not bode well for equities in general. We’ll have to wait and see if and when we get there; in the meantime, I expect some rebound efforts followed by more downside moves.
9 of our 10 ETFs in the Spotlight headed south led by the Financials (IYF) with -2.63%. Only one survived the onslaught and that was the Dividend ETF (DVY), which actually managed to squeeze out a gain of +0.08%.
2. ETFs in the Spotlight
In case you missed the announcement and description of this section, you can read it here again.
It features 10 broadly diversified ETFs from my HighVolume list as posted every Monday. Furthermore, they are screened for the lowest MaxDD% number meaning they have been showing better resistance to temporary sell offs than all others over the past year.
Here are the 10 candidates:
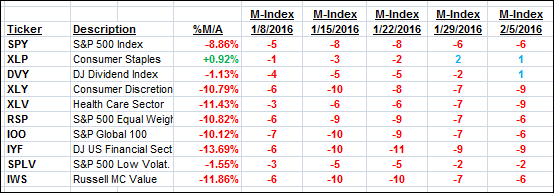
The above table simply demonstrates the magnitude with which some of the ETFs are fluctuating in regards to their positions above or below their respective individual trend lines (%M/A). A break below, represented by a negative number, shows weakness, while a break above, represented by a positive percentage, shows strength.
For hundreds of ETF/Mutual fund choices, be sure to reference Thursday’s StatSheet.
Year to date, here’s how the above candidates have fared so far:
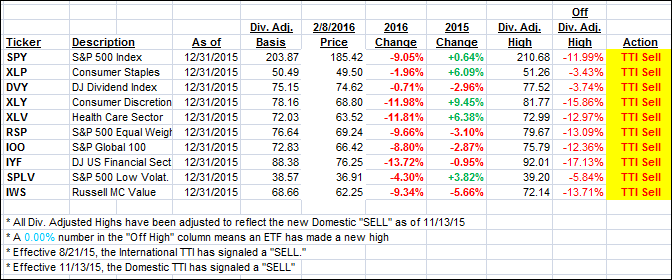
Again, the first table above shows the position of the various ETFs in relation to their respective long term trend lines (%M/A), while the second one tracks their trailing sell stops in the “Off High” column. The “Action” column will signal a “Sell” once the -7.5% point has been taken out in the “Off High” column.
3. Trend Tracking Indexes (TTIs)
Our Domestic Trend Tracking Index (TTI) dropped furher below its long-term trend line as as shown below confirming that the bear is alive and well:
Domestic TTI: -3.65% (last close -3.24%)—Sell signal effective 11/13/2015
International TTI: -12.33% (last close -10.63%)—Sell signal effective 8/21/2015
Disclosure: I am obliged to inform you that I, as well as advisory clients of mine, own some of these listed ETFs. Furthermore, they do not represent a specific investment recommendation for you, they merely show which ETFs from the universe I track are falling within the guidelines specified.
Contact Ulli