
1. Moving the Markets
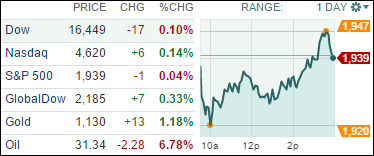
It did not look pretty at the opening with the major indexes taking a dive after Friday’s come back rally. Interesting to me was the break in correlation with oil prices, as oil got hammered at the tune of -6.78%, yet equities managed to dig themselves out of a hole and closed essentially unchanged.
If you thought there was some good news to function as a driver of this rebound, you would have been wrong. Domestic and global economic data were simply deplorable with China showing fresh signs of continued sluggishness and U.S. manufacturing data sinking into the basement. The latter was seen as “encouraging” in regards to the possibility of the Fed holding off further planned rate hikes.
Not to be outdone, Fed chairman Fischer, one of the hawkish types, commented that “the market’s expectations of barely any interest rate increases this year could turn out to be right.” Well, that was sufficient jawboning to talk the indexes out of their early doldrums and up we went. Obviously, whatever the Fed’s plans may be, their effects do supersede any economic realities for the time being.
Our 10 ETFs in the Spotlight were mixed with 5 of them rising and 5 of them falling. Leading to the upside was Consumer Discretionaries (XLY) with +0.61% while the US Financials (IYF) led to the downside with -0.47%.
2. ETFs in the Spotlight
In case you missed the announcement and description of this section, you can read it here again.
It features 10 broadly diversified ETFs from my HighVolume list as posted every Monday. Furthermore, they are screened for the lowest MaxDD% number meaning they have been showing better resistance to temporary sell offs than all others over the past year.
Here are the 10 candidates:
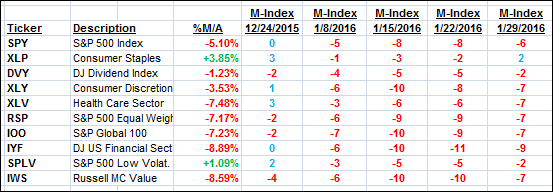
The above table simply demonstrates the magnitude with which some of the ETFs are fluctuating in regards to their positions above or below their respective individual trend lines (%M/A). A break below, represented by a negative number, shows weakness, while a break above, represented by a positive percentage, shows strength.
For hundreds of ETF/Mutual fund choices, be sure to reference Thursday’s StatSheet.
Year to date, here’s how the above candidates have fared so far:
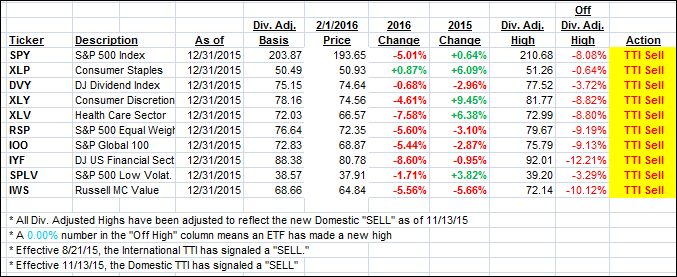
Again, the first table above shows the position of the various ETFs in relation to their respective long term trend lines (%M/A), while the second one tracks their trailing sell stops in the “Off High” column. The “Action” column will signal a “Sell” once the -7.5% point has been taken out in the “Off High” column.
3. Trend Tracking Indexes (TTIs)
Our Domestic Trend Tracking Index (TTI) did not budge with the major indexes hovering around their unchanged line.
Here’s how we closed:
Domestic TTI: -2.03% (last close -2.03%)—Sell signal effective 11/13/2015
International TTI: -8.77% (last close -8.86%)—Sell signal effective 8/21/2015
Disclosure: I am obliged to inform you that I, as well as advisory clients of mine, own some of these listed ETFs. Furthermore, they do not represent a specific investment recommendation for you, they merely show which ETFs from the universe I track are falling within the guidelines specified.
Contact Ulli