
1. Moving the Markets
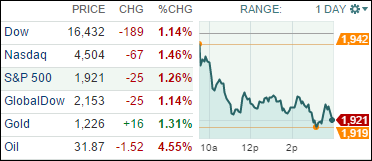
After its recent hot streak, the Dow Jones industrial average dipped back into correction territory Tuesday as stocks tumbled amid a renewed slump in oil prices and a still uncertain outlook for global growth and U.S. corporate earnings. All major indexes dropped at least 1.1% on the day.
Hopes for a near-term oil production cut were dashed today when Saudi Arabia’s oil minister said a cut is not going to happen because many oil-producing nations likely would not do so, even if they agreed to cutting production. Bloomberg also reported that Iran’s oil minister shot down calls for a production “freeze,” calling such a plan “ridiculous.”
The news pushed oil prices down about 4.75% today to 31.90 a barrel for U.S. Crude.
Domestically, the bad news continued with new orders being crushed as the Richmond Fed Manufacturing survey dropped sharply to a level not seen since 2013. The Consumer Confidence number headed south as well from 97.8 to 92.2, which was its weakest since the middle of 2015.
In banking, we heard today that Citibank (C) was ordered to pay a $3 million penalty and provide nearly $11 million in consumer relief or refunds in a settlement over illegal debt sales and debt collection practices. The stock dropped 3.3% on the day.
2. ETFs in the Spotlight
In case you missed the announcement and description of this section, you can read it here again.
It features 10 broadly diversified ETFs from my HighVolume list as posted every Monday. Furthermore, they are screened for the lowest MaxDD% number meaning they have been showing better resistance to temporary sell offs than all others over the past year.
Here are the 10 candidates:
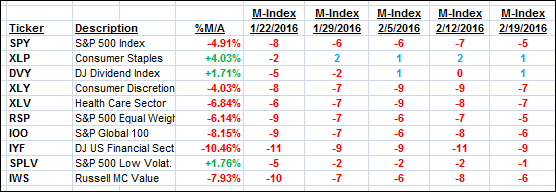
The above table simply demonstrates the magnitude with which some of the ETFs are fluctuating in regards to their positions above or below their respective individual trend lines (%M/A). A break below, represented by a negative number, shows weakness, while a break above, represented by a positive percentage, shows strength.
For hundreds of ETF/Mutual fund choices, be sure to reference Thursday’s StatSheet.
Year to date, here’s how the above candidates have fared so far:
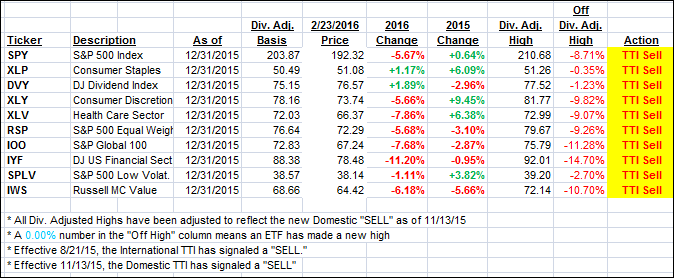
Again, the first table above shows the position of the various ETFs in relation to their respective long term trend lines (%M/A), while the second one tracks their trailing sell stops in the “Off High” column. The “Action” column will signal a “Sell” once the -7.5% point has been taken out in the “Off High” column.
3. Trend Tracking Indexes (TTIs)
Our Domestic Trend Tracking Index (TTI) headed north as the major indexes headed south led by oil, as last week’s short squeeze may have run out of steam.
Here’s how we closed:
Domestic TTI: -1.90% (last close -1.54%)—Sell signal effective 11/13/2015
International TTI: -9.27% (last close -8.31%)—Sell signal effective 8/21/2015
Disclosure: I am obliged to inform you that I, as well as advisory clients of mine, own some of these listed ETFs. Furthermore, they do not represent a specific investment recommendation for you, they merely show which ETFs from the universe I track are falling within the guidelines specified.
Contact Ulli