
1. Moving the Markets
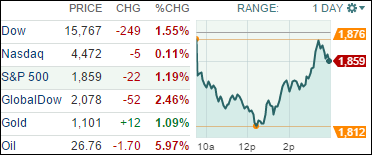
Wednesday was a wild roller coaster ride on Wall Street, with stocks moving off of earlier, huge losses and the Nasdaq almost landing in positive territory. The sell-off that has engulfed global stock markets early in 2016 intensified from the market open, with the Dow plunging as much as 565 points and oil breaking below $27 a barrel for the first time since 2003.
Sparking Wednesday’s stock sell-off around the world were many of the same worries that have dragged down shares all year: Fears of slowing growth around the globe and the continued plunge in oil at a time when markets are craving stabilization in the oil patch.
The price of West Texas Intermediate, the U.S. crude benchmark, tumbled 6% to $26.76 a barrel, its lowest closing level since May, 2003, according to the Oil Price Information Service. The price of Brent crude, the global benchmark, tumbled 3.2% to $27.10, its lowest closing mark since September, 2003.
In tech news, shares of the gadget maker plunged early Wednesday by as much as 3.4% to $93.42. The decline in Apple knocked the battleground stock near the $92 a share it fell to last August during a market malfunction. This freak-out low is the next big challenge for the shares, as investors wonder how low the stock can go. The low held strong though as the stock closed up 13 cents to $96.79.
Today’s wild ride could have ended far worse than it did, supporting what I have frequently mentioned that huge market drops followed my mind numbing recoveries are typical of bear markets. So, if you napped through my domestic Sell signal of 11/13/2015 you better realize that the bear is still with us and getting stronger—plan accordingly, before your 401k turns into a 201k.
9 of our 10 ETFs in the Spotlight headed south with only one showing some green, namely Healthcare (XLV), which eked out at +0.19% gain. Topping the losers were the Financials (IYF) with -1.92%.
2. ETFs in the Spotlight
In case you missed the announcement and description of this section, you can read it here again.
It features 10 broadly diversified ETFs from my HighVolume list as posted every Monday. Furthermore, they are screened for the lowest MaxDD% number meaning they have been showing better resistance to temporary sell offs than all others over the past year.
Here are the 10 candidates:
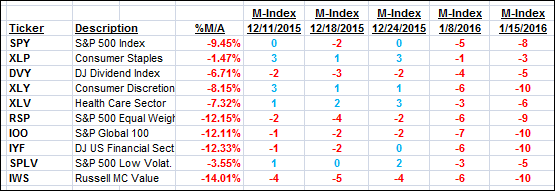
The above table simply demonstrates the magnitude with which some of the ETFs are fluctuating in regards to their positions above or below their respective individual trend lines (%M/A). A break below, represented by a negative number, shows weakness, while a break above, represented by a positive percentage, shows strength.
For hundreds of ETF/Mutual fund choices, be sure to reference Thursday’s StatSheet.
Year to date, here’s how the above candidates have fared so far:
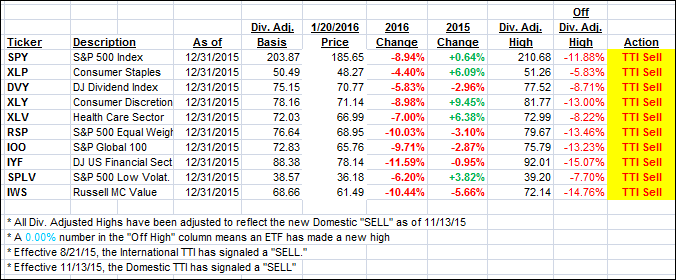
Again, the first table above shows the position of the various ETFs in relation to their respective long term trend lines (%M/A), while the second one tracks their trailing sell stops in the “Off High” column. The “Action” column will signal a “Sell” once the -7.5% point has been taken out in the “Off High” column.
3. Trend Tracking Indexes (TTIs)
Our Domestic Trend Tracking Index (TTI) headed south again confirming that the bear is very much alive. It could have been far worse, but the buy-the-dip crowd came out in full force and limited the downside damage.
Here’s how we ended today’s wild ride:
Domestic TTI: -3.74% (last close -3.63%)—Sell signal effective 11/13/2015
International TTI: -12.61% (last close -11.44%)—Sell signal effective 8/21/2015
Disclosure: I am obliged to inform you that I, as well as advisory clients of mine, own some of these listed ETFs. Furthermore, they do not represent a specific investment recommendation for you, they merely show which ETFs from the universe I track are falling within the guidelines specified.
Contact Ulli