
1. Moving the Markets
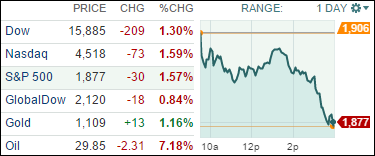
Oil continues to be the dominant market mover in the early days of 2016. Stocks ended lower Monday as oil prices dropped more than 7% and fell back to around $30 a barrel. The drop in oil prices of late is mostly due to global oversupply. It appears that none of the major oil producers are willing to cut production for fear of losing global market share, even though demand has decreased substantially over the past couple of months.
The drop in stocks comes shortly after Wall Street was able to finally bounce back last week in the market’s first week of positive returns for U.S. stocks in the New Year. But the relief rally, while welcomed and much-needed, wasn’t enough for still-shaken bulls to go out on a limb and send a definitive all-clear signal. That type of signal could most likely only come from the Fed via promises of lower interest rates and/or a new Quantitative Easing (QE) program, despite the now well known fact that QE did nothing for the economy but was instrumental in lifting the fincancial markets to their lofty levels over the past 6 years.
Investors are gearing up for a busy week of earnings, and they’ll be looking beyond the numbers. More than 130 companies in the S&P 500 are scheduled to report their fourth-quarter results this coming week, including moguls like online retailer Amazon.com (AMZN), social media firm Facebook (FB) and tech giants Microsoft (MSFT) and Apple (AAPL). It’s still early in the profit season as only 73 S&P 500 companies have reported so far. Analysts are currently forecasting companies in the S&P 500 to report 5.9% lower fourth-quarter adjusted earnings.
All of our 10 ETFs in the Spotlight headed south led by the Financials (IYF) with -2.16%. Holding up reasonably well was Consumer Staples (XLP) with -0.89%.
2. ETFs in the Spotlight
In case you missed the announcement and description of this section, you can read it here again.
It features 10 broadly diversified ETFs from my HighVolume list as posted every Monday. Furthermore, they are screened for the lowest MaxDD% number meaning they have been showing better resistance to temporary sell offs than all others over the past year.
Here are the 10 candidates:
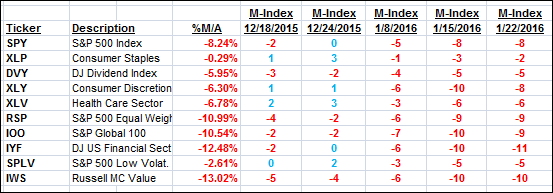
The above table simply demonstrates the magnitude with which some of the ETFs are fluctuating in regards to their positions above or below their respective individual trend lines (%M/A). A break below, represented by a negative number, shows weakness, while a break above, represented by a positive percentage, shows strength.
For hundreds of ETF/Mutual fund choices, be sure to reference Thursday’s StatSheet.
Year to date, here’s how the above candidates have fared so far:
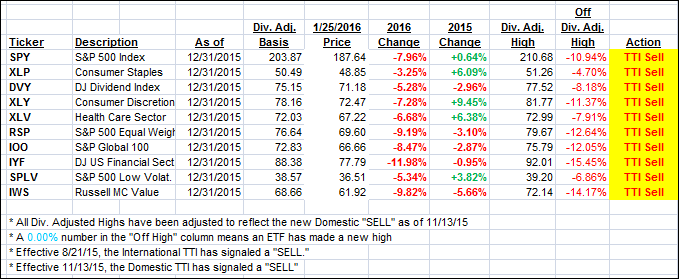
Again, the first table above shows the position of the various ETFs in relation to their respective long term trend lines (%M/A), while the second one tracks their trailing sell stops in the “Off High” column. The “Action” column will signal a “Sell” once the -7.5% point has been taken out in the “Off High” column.
3. Trend Tracking Indexes (TTIs)
Our Domestic Trend Tracking Index (TTI) reversed and headed south as a sharp drop in oil prices pulled the major indexes lower wiping out last week’s gains.
Here’s how we ended up:
Domestic TTI: -3.33% (last close -2.78%)—Sell signal effective 11/13/2015
International TTI: -11.28% (last close -10.16%)—Sell signal effective 8/21/2015
Disclosure: I am obliged to inform you that I, as well as advisory clients of mine, own some of these listed ETFs. Furthermore, they do not represent a specific investment recommendation for you, they merely show which ETFs from the universe I track are falling within the guidelines specified.
Contact Ulli