
1. Moving the Markets
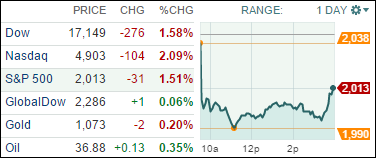
Stocks around the world plunged on the first trading day of 2016, with the Dow diving 470 points in intraday trading before moderating its losses amid fresh signs of slowing growth in China, the world’s second-biggest economy. All three major indexes got spanked as the chart above shows.
2016’s rocky beginning came as many of the same worries that held stocks back last year reappeared, prompting investors to sell equities and reduce risk.
China was the main culprit today, as we received a weaker-than-expected reading on Chinese manufacturing that showed continued contraction in one of the world’s most important economies. The lackluster numbers raised fresh fears about the global growth outlook for 2016 and the profit outlook for companies around the globe. It also sparked a massive stock market sell-off in mainland China, where shares tumbled more than 7%, forcing authorities to halt trading for the day before the normal closing time.
Fresh data in today on U.S. manufacturing added to investor fears about a global economic slowdown. An index of U.S. factory activity fell to 48.2 from 48.6, the Institute for Supply Management said Monday. That’s the lowest level since June 2009 and the second straight month of reading below 50, signaling contraction in the sector.
One bad day, even if it’s the first day of a new year, doesn’t mean that stock market returns will be horrific for the full year. It just signals that volatility is still present trailing from 2015 along with the uncertainty of what the effects of ever weakening economic data points will have on equities. Will have to wait and see if today was simply an outlier or the final nail in the coffin of a much overextended bull market.
All of our 10 ETFs in the Spotlight followed the theme of world markets and closed down. Giving back the most was the Financials (IYF) with -1.92% while the Dividend Select ETF (DVY) held up best with -0.79%.
2. ETFs in the Spotlight
In case you missed the announcement and description of this section, you can read it here again.
It features 10 broadly diversified ETFs from my HighVolume list as posted every Monday. Furthermore, they are screened for the lowest MaxDD% number meaning they have been showing better resistance to temporary sell offs than all others over the past year.
Here are the 10 candidates:
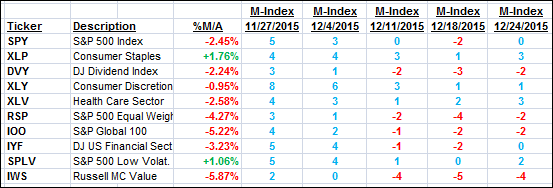
The above table simply demonstrates the magnitude with which some of the ETFs are fluctuating in regards to their positions above or below their respective individual trend lines (%M/A). A break below, represented by a negative number, shows weakness, while a break above, represented by a positive percentage, shows strength.
For hundreds of ETF/Mutual fund choices, be sure to reference Thursday’s StatSheet.
Year to date, here’s how the above candidates have fared so far:
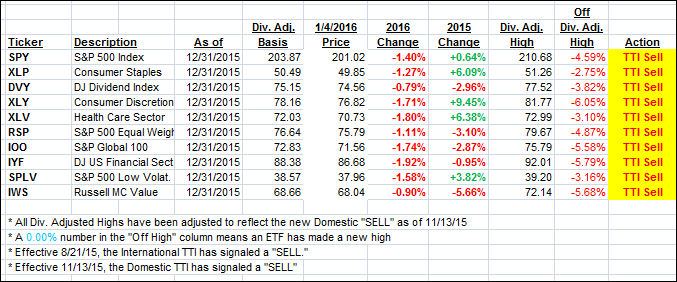
Again, the first table above shows the position of the various ETFs in relation to their respective long term trend lines (%M/A), while the second one tracks their trailing sell stops in the “Off High” column. The “Action” column will signal a “Sell” once the -7.5% point has been taken out in the “Off High” column.
3. Trend Tracking Indexes (TTIs)
Our Domestic Trend Tracking Index (TTI) headed south and dipped into bear market territory by the largest margin since our 11/13/15 Sell signal.
Here’s how we closed:
Domestic TTI: -1.42% (last close -0.70%)—Sell signal effective 11/13/2015
International TTI: -5.85% (last close -4.28%)—Sell signal effective 8/21/2015
Disclosure: I am obliged to inform you that I, as well as advisory clients of mine, own some of these listed ETFs. Furthermore, they do not represent a specific investment recommendation for you, they merely show which ETFs from the universe I track are falling within the guidelines specified.
Contact Ulli