
1. Moving the Markets
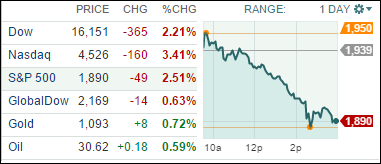
Intense selling returned to Wall Street in afternoon trading Wednesday, pushing the Dow down 365 points and slicing 3.4% off of the tech-packed Nasdaq, dashing hopes for a third straight day of gains on Wall Street and extending the financial pain in what has been a horrific start to the year.
Earlier in the day, it appeared the market math was basic Arithmetic 101: Better data from China plus higher oil prices equals higher stock prices. But that investment thesis gave way later to fears of a global recession and the decision of investors to pare back risk and sell stocks confirming that the bearish trend is in full force.
We heard some disappointing news from GoPro (GPRO) today. The company said it only expects to post revenue of $435 million during the fourth quarter, missing analysts forecasts calling for revenue of $508 million by 14%. The company blamed lower than anticipated sales of its capture devices due to slower than expected sell through at retailers. They also announced it would cut 7% of its workforce of more than 1,500 employees as of the end of 2015. GoPro is one of the most severe examples of the recent crop of over-hyped technology companies selling hardware and winning a huge valuation with investors. The dose of reality seems to be spreading.
All of our 10 ETFs in the Spotlight shifted into reverse and got spanked as the bears took charge. Getting downright clobbered was Consumer Discretionaries (XLY) with -3.37%. Resisting the mauling the best were the Select Dividend ETF (DVY) and the Low Volatility ETF (SPLV) which each gave back -1.50%.
This is the time for preservation of capital, and we continue to stay on the sidelines.
2. ETFs in the Spotlight
In case you missed the announcement and description of this section, you can read it here again.
It features 10 broadly diversified ETFs from my HighVolume list as posted every Monday. Furthermore, they are screened for the lowest MaxDD% number meaning they have been showing better resistance to temporary sell offs than all others over the past year.
Here are the 10 candidates:
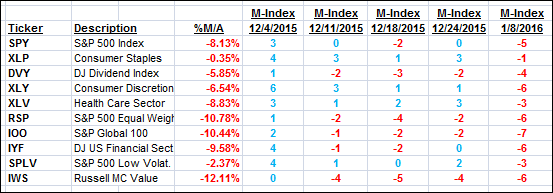
The above table simply demonstrates the magnitude with which some of the ETFs are fluctuating in regards to their positions above or below their respective individual trend lines (%M/A). A break below, represented by a negative number, shows weakness, while a break above, represented by a positive percentage, shows strength.
For hundreds of ETF/Mutual fund choices, be sure to reference Thursday’s StatSheet.
Year to date, here’s how the above candidates have fared so far:
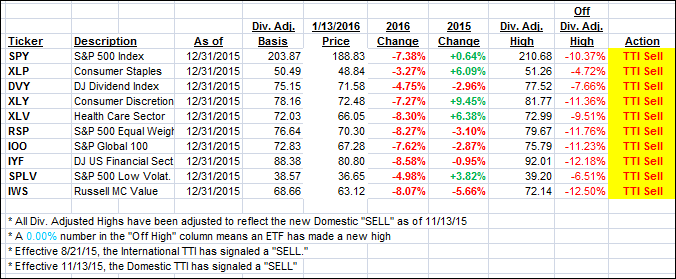
Again, the first table above shows the position of the various ETFs in relation to their respective long term trend lines (%M/A), while the second one tracks their trailing sell stops in the “Off High” column. The “Action” column will signal a “Sell” once the -7.5% point has been taken out in the “Off High” column.
3. Trend Tracking Indexes (TTIs)
Our Domestic Trend Tracking Index (TTI) moved deeper into bear market territory confirming that downward momentum is accelerating. This is not the time to try to be a hero and engage in some bottom fishing since markets tend to go down a lot faster than they go up.
Here’s how we closed:
Domestic TTI: -3.56% (last close -2.58%)—Sell signal effective 11/13/2015
International TTI: -10.91% (last close -9.49%)—Sell signal effective 8/21/2015
Disclosure: I am obliged to inform you that I, as well as advisory clients of mine, own some of these listed ETFs. Furthermore, they do not represent a specific investment recommendation for you, they merely show which ETFs from the universe I track are falling within the guidelines specified.
Contact Ulli