
1. Moving the Markets
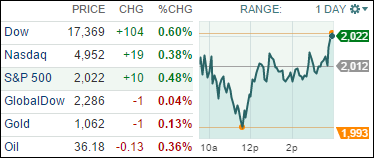
Stocks climbed at the last minute today ahead of Wednesday’s expected Fed rate hike as oil prices found some stability and edged higher.
Oil sold on U.S. markets is priced slightly above $36 a barrel, up 1.7%, after futures slipped to below $35 a barrel earlier in the day. In recent days, the prices for oil in the U.S. and for Brent crude, from the North Sea, have hit six- and seven-year lows, respectively.
Shell (RDS) says it is cutting 2,800 jobs in a pre-planned administrative move, but that the job cuts, amounting to 3% of its workforce, have more to do with the company finalizing its takeover of British-based BG Group, not oil prices.
This week brings the equivalent of the Super Bowl for economists, with the Federal Reserve all but certain to raise interest rates for the first time in nearly a decade. Much of the drama after Wednesday’s meeting will revolve around the signals Fed policymakers send about the pace of subsequent hikes. Before it acts, however, the Fed will review a final batch of economic reports on inflation, housing and industrial production.
9 of our 10 ETFs in the Spotlight edged higher as the markets rebounded into the close. Consumer Staples (XLP) led with +1.05% while the Mid-Cap Value ETF (IWS) slipped -0.40%.
2. ETFs in the Spotlight
In case you missed the announcement and description of this section, you can read it here again.
It features 10 broadly diversified ETFs from my HighVolume list as posted every Monday. Furthermore, they are screened for the lowest MaxDD% number meaning they have been showing better resistance to temporary sell offs than all others over the past year.
Here are the 10 candidates:
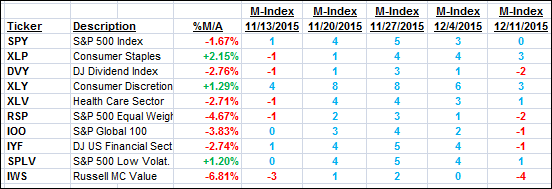
The above table simply demonstrates the magnitude with which some of the ETFs are fluctuating in regards to their positions above or below their respective individual trend lines (%M/A). A break below, represented by a negative number, shows weakness, while a break above, represented by a positive percentage, shows strength.
For hundreds of ETF/Mutual fund choices, be sure to reference Thursday’s StatSheet.
Year to date, here’s how the above candidates have fared so far:
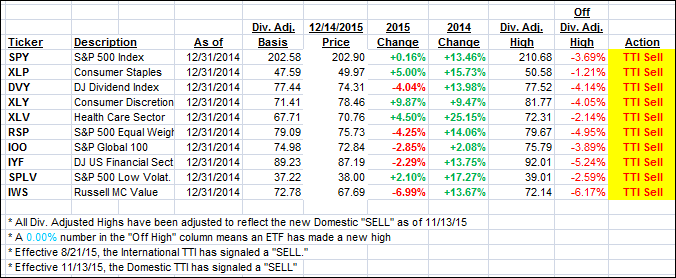
Again, the first table above shows the position of the various ETFs in relation to their respective long term trend lines (%M/A), while the second one tracks their trailing sell stops in the “Off High” column. The “Action” column will signal a “Sell” once the -7.5% point has been taken out in the “Off High” column.
3. Trend Tracking Indexes (TTIs)
Our Domestic Trend Tracking Index (TTI) improved ever so slightly as today’s last minute rebound pushed the major indexes above the unchanged line. Nevertheless, we still remain in bear market territory.
Here’s how we ended up:
Domestic TTI: -1.16% (last close -1.19%)—Sell signal effective 11/13/2015
International TTI: -6.23% (last close -5.85%)—Sell signal effective 8/21/2015
Disclosure: I am obliged to inform you that I, as well as advisory clients of mine, own some of these listed ETFs. Furthermore, they do not represent a specific investment recommendation for you, they merely show which ETFs from the universe I track are falling within the guidelines specified.
Contact Ulli