
1. Moving the Markets
While December is usually a favorable month for publicly traded stocks, it is never an easy “sleigh ride” through the New Year. Snow has its soft and hard patches, but it’s allegedly all worth the ride as they say.
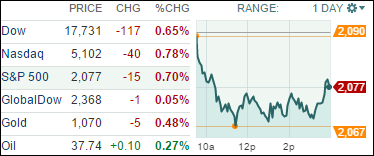
The stock market took a stiff hit Monday as oil prices tumbled to a seven-year low, sparking a sell-off in energy stocks that mostly wiped out a chunk of Friday’s big rally that saw the Dow jump 370 points on a strong November jobs report.
Oil prices plunged nearly 6% today after OPEC decided last week not to constrain production, despite an oversupplied global market and reports that showed rising crude stockpiles in the U.S. Domestically, the Benchmark U.S. crude index dropped $2.32, or 5.8%, to $37.65 a barrel, which was the first close below $38 a barrel since early 2009.
In the M&A space, we heard today that Keurig Green Mountain (GMCR), which manufactures coffee-makers and instant flavor pods, has agreed to be purchased for $13.9 billion by an investment group led by private-equity firm JAB Holding Co. The deal marks nearly a 78% premium over Friday’s closing price for Keurig shares. The stock rose 72% to close Monday at $88.89.
All eyes remain fixed on the Fed’s meeting later this month regarding a potential interest rate hike. But let’s not let that damper the holiday spirit. Holiday shoppers are out across the nation, but it’s uncertain whether we’ll get enough positive numbers on holiday sales come early January.
9 of our 10 ETFs in the Spotlight reversed and headed south as oil pulled the indexes off their lofty levels reached last Friday. Bucking the trend was Consumer Staples (XLP) with +0.28%; the downside leader was the Mid-Cap Value (IWS), which gave back -1.27%.
2. ETFs in the Spotlight
In case you missed the announcement and description of this section, you can read it here again.
It features 10 broadly diversified ETFs from my HighVolume list as posted every Monday. Furthermore, they are screened for the lowest MaxDD% number meaning they have been showing better resistance to temporary sell offs than all others over the past year.
Here are the 10 candidates:
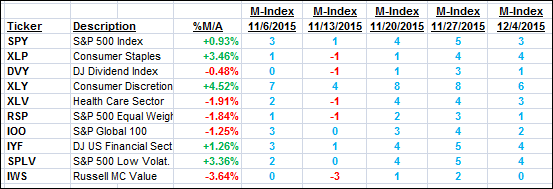
The above table simply demonstrates the magnitude with which some of the ETFs are fluctuating in regards to their positions above or below their respective individual trend lines (%M/A). A break below, represented by a negative number, shows weakness, while a break above, represented by a positive percentage, shows strength.
For hundreds of ETF/Mutual fund choices, be sure to reference Thursday’s StatSheet.
Year to date, here’s how the above candidates have fared so far:
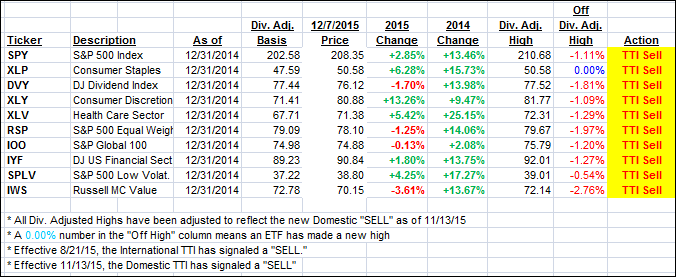
Again, the first table above shows the position of the various ETFs in relation to their respective long term trend lines (%M/A), while the second one tracks their trailing sell stops in the “Off High” column. The “Action” column will signal a “Sell” once the -7.5% point has been taken out in the “Off High” column.
3. Trend Tracking Indexes (TTIs)
Our Domestic Trend Tracking Index (TTI) slipped and moved closer to its trend line. We are still not seeing a clear breakout to the upside and will have to be patient to see how this sideways pattern plays out.
Here’s how we closed:
Domestic TTI: +0.27% (last close +0.61%)—Sell signal effective 11/13/2015
International TTI: -3.65% (last close -2.95%)—Sell signal effective 8/21/2015
Disclosure: I am obliged to inform you that I, as well as advisory clients of mine, own some of these listed ETFs. Furthermore, they do not represent a specific investment recommendation for you, they merely show which ETFs from the universe I track are falling within the guidelines specified.
Contact Ulli