
1. Moving the Markets
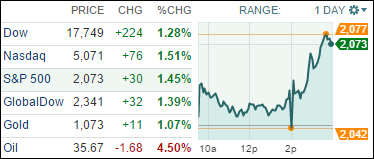
Heading into decision day for the Fed, skeptics warned that an increase in rates could cause market volatility and upheaval. Well, the exact opposite happened today as it seems that Wall Street bulls viewed the Fed’s rate hike as a sign of an improving economy. The question in my mind is as to whether this euphoric reaction represents simply a relief rally or the continuation of the bullish trend. We’ll have to be patient and give it a little time to see if upward momentum can be maintained.
The Fed delivered the news in a policy statement, which read: “Given the economic outlook, and recognizing the time it takes for policy actions to affect future economic outcomes, the Committee decided to raise the target range for the federal funds rate to 0.25% to 0.50%”.
Wall Street also got the forward guidance it wanted to so hear on the pace of future hikes in 2016: “The Committee expects that economic conditions will evolve in a manner that will warrant only gradual increases,” the statement read. The key word, of course, was “gradual.”
In oil news today, we heard that congress reached a deal late Tuesday on a $1.1 trillion spending bill that would end the four-decade-long ban on most U.S. exports of crude oil. Facing plunging revenue and profits, U.S. oil and gas companies have announced 250,000 layoffs this year, according to a November report by consultant Graves & Co. that was cited by Bloomberg. The fact that U.S. producers may finally be allowed to sell unrefined crude oil to foreign customers is a welcome development to the industry but hardly a boon to the bottom line.
All of our 10 ETFs in the Spotlight headed higher as the rebound continued. Consumer Staples (XLP) led with +1.93%, while the Mid-Cap Value (IWS) lagged but still gained +1.21%.
2. ETFs in the Spotlight
In case you missed the announcement and description of this section, you can read it here again.
It features 10 broadly diversified ETFs from my HighVolume list as posted every Monday. Furthermore, they are screened for the lowest MaxDD% number meaning they have been showing better resistance to temporary sell offs than all others over the past year.
Here are the 10 candidates:
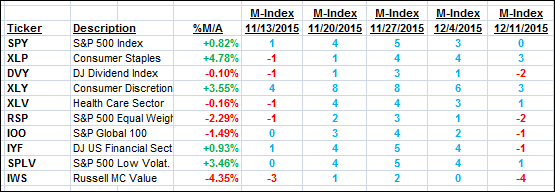
The above table simply demonstrates the magnitude with which some of the ETFs are fluctuating in regards to their positions above or below their respective individual trend lines (%M/A). A break below, represented by a negative number, shows weakness, while a break above, represented by a positive percentage, shows strength.
For hundreds of ETF/Mutual fund choices, be sure to reference Thursday’s StatSheet.
Year to date, here’s how the above candidates have fared so far:
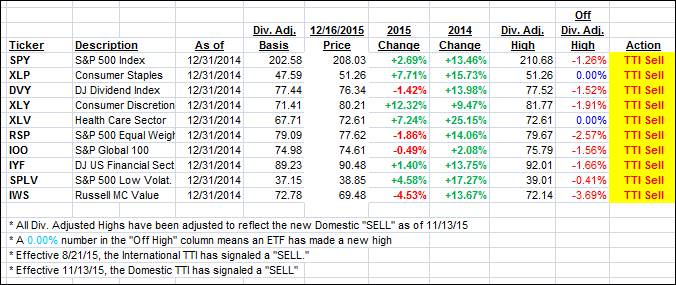
Again, the first table above shows the position of the various ETFs in relation to their respective long term trend lines (%M/A), while the second one tracks their trailing sell stops in the “Off High” column. The “Action” column will signal a “Sell” once the -7.5% point has been taken out in the “Off High” column.
3. Trend Tracking Indexes (TTIs)
Our Domestic Trend Tracking Index (TTI) headed closer to its trend line but remained on the bearish side for the time being. Should upward momentum continue we will need to see a clear and consistent piercing of the trend line to the upside before I issue a new “Buy” signal.
Here’s how we closed:
Domestic TTI: -0.13% (last close -0.72%)—Sell signal effective 11/13/2015
International TTI: -4.18% (last close -5.47%)—Sell signal effective 8/21/2015
Disclosure: I am obliged to inform you that I, as well as advisory clients of mine, own some of these listed ETFs. Furthermore, they do not represent a specific investment recommendation for you, they merely show which ETFs from the universe I track are falling within the guidelines specified.
Contact Ulli