
1. Moving the Markets
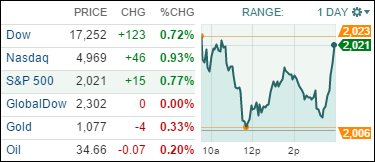
Oil prices headed south again but investors did not care as domestic indexes were mixed early on but suddenly rallied into the close as choppiness prevailed. There was no news event supporting the sudden intra-day trend reversal as energy showed continued weakness and European markets suffered a severe sell-off.
With the volatility of recent days it’s hard to read anything into these bounces other than seasonality, but with volume slowing more choppiness is sure to be in the cards for the remainder of this year. However, I doubt as to whether meaningful upward momentum can turn into the now overdue but still longed for Santa Claus rally.
9 of our 10 ETFs in the Spotlight edged higher with Consumer Staples (XLP) as the front runner (+1.09%) and the Global 100 (IOO) as the laggard (-0.47%).
2. ETFs in the Spotlight
In case you missed the announcement and description of this section, you can read it here again.
It features 10 broadly diversified ETFs from my HighVolume list as posted every Monday. Furthermore, they are screened for the lowest MaxDD% number meaning they have been showing better resistance to temporary sell offs than all others over the past year.
Here are the 10 candidates:
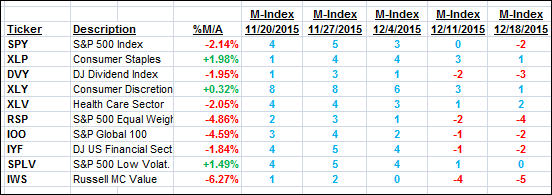
The above table simply demonstrates the magnitude with which some of the ETFs are fluctuating in regards to their positions above or below their respective individual trend lines (%M/A). A break below, represented by a negative number, shows weakness, while a break above, represented by a positive percentage, shows strength.
For hundreds of ETF/Mutual fund choices, be sure to reference Thursday’s StatSheet.
Year to date, here’s how the above candidates have fared so far:
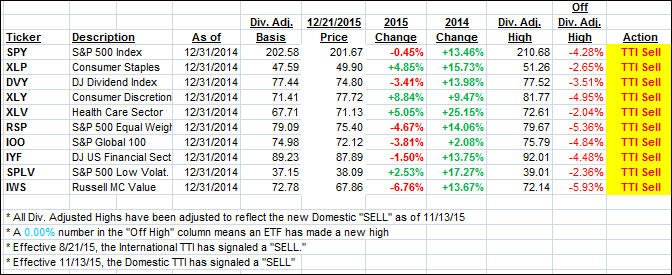
Again, the first table above shows the position of the various ETFs in relation to their respective long term trend lines (%M/A), while the second one tracks their trailing sell stops in the “Off High” column. The “Action” column will signal a “Sell” once the -7.5% point has been taken out in the “Off High” column.
3. Trend Tracking Indexes (TTIs)
Our Domestic Trend Tracking Index (TTI) improved slightly but remains bearish.
Here’s how we closed:
Domestic TTI: -1.09% (last close -1.39%)—Sell signal effective 11/13/2015
International TTI: -5.74% (last close -6.06%)—Sell signal effective 8/21/2015
Disclosure: I am obliged to inform you that I, as well as advisory clients of mine, own some of these listed ETFs. Furthermore, they do not represent a specific investment recommendation for you, they merely show which ETFs from the universe I track are falling within the guidelines specified.
Contact Ulli