
1. Moving the Markets
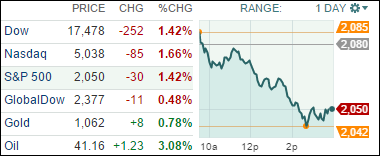
The S&P 500 index dropped back into the red for 2015, and the Dow ended down 252 points at 17,478 today after the ECB announced fresh stimulus efforts that didn’t meet the lofty expectations of investors.
It was all about Europe today, as ECB President Mario Draghi failed to deliver on the market’s hopes for a steep interest rate cut. The failure to give the EU market the amount of stimulus it hoped for caused the euro to spike against the dollar, a development that hinders the ECB’s ability to jump-start growth and boost “dangerously” low inflation. Let us not forget that a stronger euro makes European exports more expensive and less competitive.
On to China. China’s government praised this week’s decision by the IMF to add the yuan to the world’s elite reserve currencies, saying it was recognition of the government’s decades-long effort to reform its economy. The move by the IMF on Monday comes as China is at economic and financial crossroads. Slowing growth has pushed the ruling communist party to jettison the state-led development model and to advocate for a more market-driven, less interventionist system. The yuan will join the reserve currencies on Oct. 1, 2016, bringing the total number of currencies to five, along with the Japanese yen, U.S. dollar, British pound and euro.
Wall Street on Friday is poised for the November employment report. If the U.S. economy continued to create jobs at a solid pace last month, after producing a better-than-expected 271,000 jobs in October, it will likely cement a Fed rate hike on Dec. 16, barring any shocks between now and then.
To no surprise, all of our 10 ETFs in the Spotlight slipped with the indexes and closed lower. Healthcare (XLV) took top billing with -2.19% while Consumer Staples (XLP) showed the most stability by surrendering only -0.52%.
2. ETFs in the Spotlight
In case you missed the announcement and description of this section, you can read it here again.
It features 10 broadly diversified ETFs from my HighVolume list as posted every Monday. Furthermore, they are screened for the lowest MaxDD% number meaning they have been showing better resistance to temporary sell offs than all others over the past year.
Here are the 10 candidates:
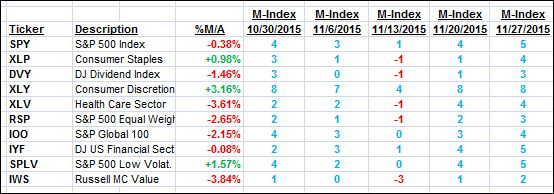
The above table simply demonstrates the magnitude with which some of the ETFs are fluctuating in regards to their positions above or below their respective individual trend lines (%M/A). A break below, represented by a negative number, shows weakness, while a break above, represented by a positive percentage, shows strength.
For hundreds of ETF/Mutual fund choices, be sure to reference Thursday’s StatSheet.
Year to date, here’s how the above candidates have fared so far:
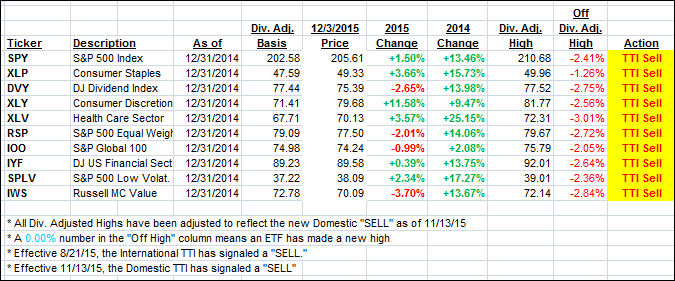
Again, the first table above shows the position of the various ETFs in relation to their respective long term trend lines (%M/A), while the second one tracks their trailing sell stops in the “Off High” column. The “Action” column will signal a “Sell” once the -7.5% point has been taken out in the “Off High” column.
3. Trend Tracking Indexes (TTIs)
Our Domestic Trend Tracking Index (TTI) took a hit and dropped back below its long-term trend line rewarding our patience of not rushing eagerly into a new potential domestic “Buy” signal in the absence of a clear piercing of the line to the upside.
Here’s how we closed:
Domestic TTI: -0.26% (last close +0.52%)—Sell signal effective 11/13/2015
International TTI: -3.80% (last close -3.03%)—Sell signal effective 8/21/2015
Disclosure: I am obliged to inform you that I, as well as advisory clients of mine, own some of these listed ETFs. Furthermore, they do not represent a specific investment recommendation for you, they merely show which ETFs from the universe I track are falling within the guidelines specified.
Contact Ulli