
ETF/No Load Fund Tracker StatSheet
————————————————————-
THE LINK TO OUR CURRENT ETF/MUTUAL FUND STATSHEET IS:
————————————————————
Market Commentary
NOT AN IDEAL WAY TO ROUND OUT THE WEEK
1. Moving the Markets
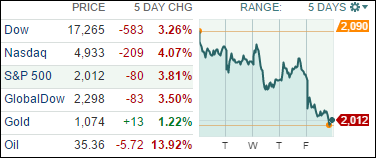
The stock market capped off its worst week since August today as oil prices set a new seven-year low and investors braced for the increasing certainty that the Fed will boost short-term interest rates next week.
Apparently, Wall Street is interpreting the selloff in oil prices due to weak economic demand. A barrel of U.S. oil lost 3.5% to about $35.50, a level last seen in early 2009. Weak oil prices are hammering the profits of energy companies, which are a big component of the S&P 500 companies’ total profits.
The market has grown increasingly volatile over the past three months as investors look ahead to next week’s meeting of the Fed’s policy-making committee and what the central bank has signaled will likely bring its first interest rate hike in nearly a decade. Record-low interest rates near 0% have been one of the major fuels for the bull market in stocks since 2008, which is now well into its seventh year.
In tech news, GoPro (GPRO) shares continued climbed higher Friday following an analyst report suggesting the high-def camera maker could be an acquisition target for Apple (AAPL). On Thursday, FBR Capital Markets analyst Daniel Ives listed GoPro among possible companies Apple could acquire next year. Also on the list: software maker Adobe, cloud company Box and electric car maker Tesla.
All of our 10 ETFs in the Spotlight hid the skids today and closed lower. The loser of the day was the Discretionary ETF (XLY) with -2.28%. Resisting the sell-off the best was Consumer Staples with a loss of -1.10%.
We have now clearly slipped back into bear market territory, as section 3 below shows, and a 100% cash position is my preferred choice.
2. ETFs in the Spotlight
In case you missed the announcement and description of this section, you can read it here again.
It features 10 broadly diversified ETFs from my HighVolume list as posted every Monday. Furthermore, they are screened for the lowest MaxDD% number meaning they have been showing better resistance to temporary sell offs than all others over the past year.
Here are the 10 candidates:
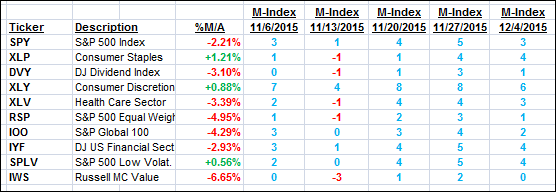
The above table simply demonstrates the magnitude with which some of the ETFs are fluctuating in regards to their positions above or below their respective individual trend lines (%M/A). A break below, represented by a negative number, shows weakness, while a break above, represented by a positive percentage, shows strength.
For hundreds of ETF/Mutual fund choices, be sure to reference Thursday’s StatSheet.
Year to date, here’s how the above candidates have fared so far:
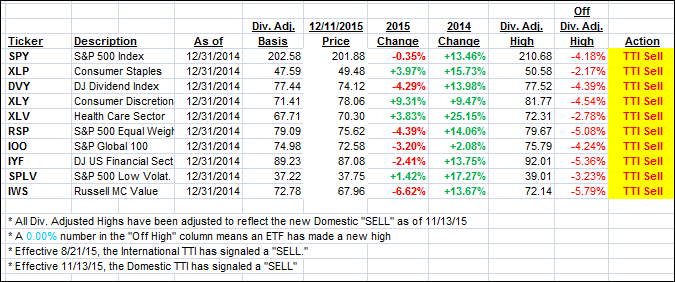
Again, the first table above shows the position of the various ETFs in relation to their respective long term trend lines (%M/A), while the second one tracks their trailing sell stops in the “Off High” column. The “Action” column will signal a “Sell” once the -7.5% point has been taken out in the “Off High” column.
3. Trend Tracking Indexes (TTIs)
Our Domestic Trend Tracking Index (TTI) took a dive and clearly finished back on the bearish side of its trend line with the International TTI sinking even deeper. Volatility has increased and, given the upcoming events next week, anything in terms of momentum swings is possible.
First, the most widely anticipated moment will come about on Wednesday when the Fed is expected to raise interest rates. That announcement could move markets in either direction.
Second, and not in focus by many, is an event that could be far more troubling and that will occur next Friday. There are $1.3 trillion of S&P 500 options expiring, a record number in many years, which can affect volatility and market direction to an unknown degree and amplitude.
Right now, it’s good to be on the sidelines.
Here’s how we closed this week:
Domestic TTI: -1.19% (last Friday +0.61%)—Sell signal effective 11/13/2015
International TTI: -5.85% (last Friday -2.95%)—Sell signal effective 8/21/2015
Have a great weekend.
Ulli…
Disclosure: I am obliged to inform you that I, as well as advisory clients of mine, own some of these listed ETFs. Furthermore, they do not represent a specific investment recommendation for you, they merely show which ETFs from the universe I track are falling within the guidelines specified.
————————————————————-
READER Q & A FOR THE WEEK
All Reader Q & A’s are listed at our web site!
Check it out at:
https://theetfbully.com/questions-answers/
———————————————————-
WOULD YOU LIKE TO HAVE YOUR INVESTMENTS PROFESSIONALLY MANAGED?
Do you have the time to follow our investment plans yourself? If you are a busy professional who would like to have his portfolio managed using our methodology, please contact me directly or get more details at:
https://theetfbully.com/personal-investment-management/
———————————————————
Back issues of the ETF/No Load Fund Tracker are available on the web at:
https://theetfbully.com/newsletter-archives/
Contact Ulli