
1. Moving the Markets
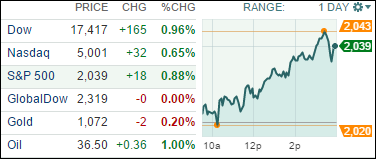
Finally, crude oil showed some signs of life by bouncing off its multi-year lows and gaining 1% for the day. The effect on the major indexes was a positive one as they got pulled higher along with all 10 S&P sectors despite the plunge in existing home sales (-10.5%).
Still, extreme December volatility pushed the major indexes around with the Dow posting its 14th 100 point move in the last 16 trading days. With volume slowing down as Christmas approaches, I would expect more of the same but will not read too much into any extreme market swings until after the New Year.
All of our 10 ETFs in the Spotlight managed to close in the green with Consumer Staples (XLP) leading the pack at +1.30%. Lagging behind was Healthcare (XLV) with +0.67%.
2. ETFs in the Spotlight
In case you missed the announcement and description of this section, you can read it here again.
It features 10 broadly diversified ETFs from my HighVolume list as posted every Monday. Furthermore, they are screened for the lowest MaxDD% number meaning they have been showing better resistance to temporary sell offs than all others over the past year.
Here are the 10 candidates:
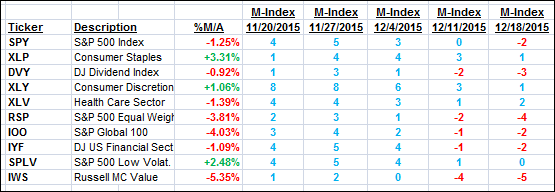
The above table simply demonstrates the magnitude with which some of the ETFs are fluctuating in regards to their positions above or below their respective individual trend lines (%M/A). A break below, represented by a negative number, shows weakness, while a break above, represented by a positive percentage, shows strength.
For hundreds of ETF/Mutual fund choices, be sure to reference Thursday’s StatSheet.
Year to date, here’s how the above candidates have fared so far:
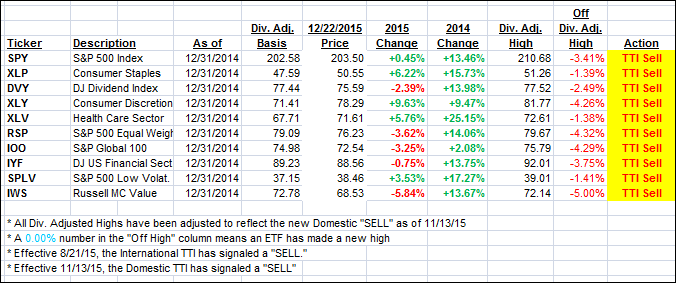
Again, the first table above shows the position of the various ETFs in relation to their respective long term trend lines (%M/A), while the second one tracks their trailing sell stops in the “Off High” column. The “Action” column will signal a “Sell” once the -7.5% point has been taken out in the “Off High” column.
3. Trend Tracking Indexes (TTIs)
Our Domestic Trend Tracking Index (TTI) improved again but remains on the bearish side of its trend line.
Here’s how we ended up:
Domestic TTI: -0.79% (last close -1.09%)—Sell signal effective 11/13/2015
International TTI: -5.17% (last close -5.74%)—Sell signal effective 8/21/2015
Disclosure: I am obliged to inform you that I, as well as advisory clients of mine, own some of these listed ETFs. Furthermore, they do not represent a specific investment recommendation for you, they merely show which ETFs from the universe I track are falling within the guidelines specified.
Contact Ulli