
1. Moving the Markets
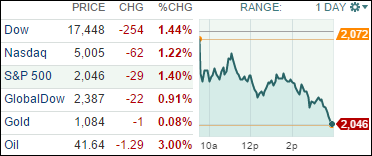
Stocks tumbled during an ugly session as the Dow dropped and the S&P 500 slid back into the red for the year.
A sharp drop in oil prices were the partial culprit for today’s decline. Energy shares led the decliners for a second straight day as oil prices tumbled again after a government report showed crude stockpiles grew by 4.2 million more barrels than expected last week. U.S. benchmark crude fell 2.7% to $41.77 a barrel and has dropped five of the last six days.
Also giving investors pause today were renewed fears about valuations, which have climbed back into overvalued territory following the big post-August rally and ongoing concerns about the economic impact of a slowdown in China.
There were several attempts throughout the day by a top line up of Fed officials to try to talk the markets back higher. ZH posted the following chart on this topic:
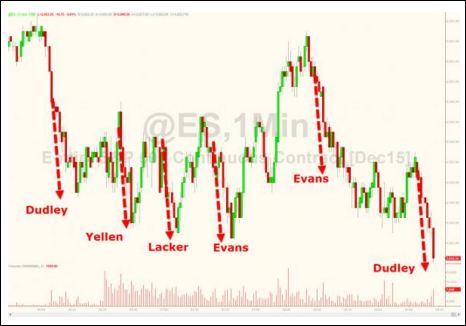
Obviously, it was a failed attempt as the indexes continued their march further south and closed pretty ugly at the lows of the day. We’ve seen that movie before: Strong sell-off on Thursday, acceleration to the downside on Friday and a total dump on Monday.
Of course, you can’t be sure if this will happen again, but with our Domestic TTI now having slipped to -0.67%, I will reduce some of our holdings tomorrow. Good thing we were only partially invested for this current Buy signal.
What would change my mind tomorrow? If there is a strong rebound in the making within the first couple of hours, or so, I may hold off with going to all cash, but I intend to reduce exposure. However, if the indexes continue to slip, I will move out of the market 100%. So, if you are managing your own monies and are concerned, you might follow a similar theme.
In light of the above, it comes as no surprise that all of our 10 ETFs in the Spotlight tanked as well with Healthcare (XLV) giving back the most at -1.73%. Resisting the sell-off the best were the Consumer Discretionaries (XLY) with -0.93%.
2. ETFs in the Spotlight
In case you missed the announcement and description of this section, you can read it here again.
It features 10 broadly diversified ETFs from my HighVolume list as posted every Monday. Furthermore, they are screened for the lowest MaxDD% number meaning they have been showing better resistance to temporary sell offs than all others over the past year.
Here are the 10 candidates:
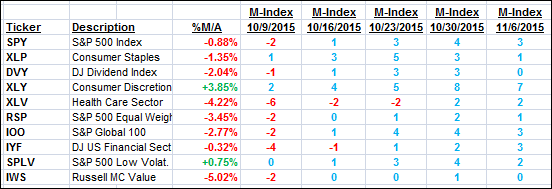
The above table simply demonstrates the magnitude with which some of the ETFs are fluctuating in regards to their positions above or below their respective individual trend lines (%M/A). A break below, represented by a negative number, shows weakness, while a break above, represented by a positive percentage, shows strength.
For hundreds of ETF/Mutual fund choices, be sure to reference Thursday’s StatSheet.
Year to date, here’s how the above candidates have fared so far:
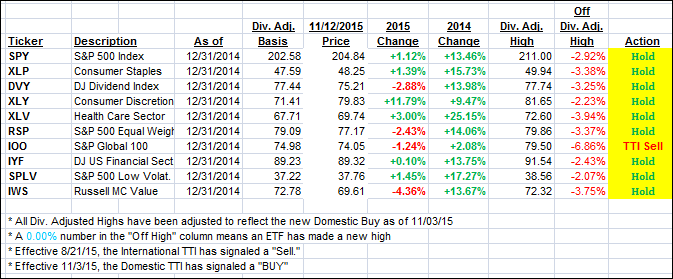
Again, the first table above shows the position of the various ETFs in relation to their respective long term trend lines (%M/A), while the second one tracks their trailing sell stops in the “Off High” column. The “Action” column will signal a “Sell” once the -7.5% point has been taken out in the “Off High” column.
3. Trend Tracking Indexes (TTIs)
Our Domestic Trend Tracking Index (TTI) headed south and settled deeper into bear market territory. As pointed out above (section 1), I will reduce our holdings tomorrow and may even go to all cash should the indexes slip and slide further south.
Here’s how we closed:
Domestic TTI: -0.67% (last close -0.04%)—Buy signal effective 11/3/2015
International TTI: -4.39% (last close -3.40%)—Sell signal effective 8/21/2015
Disclosure: I am obliged to inform you that I, as well as advisory clients of mine, own some of these listed ETFs. Furthermore, they do not represent a specific investment recommendation for you, they merely show which ETFs from the universe I track are falling within the guidelines specified.
Contact Ulli
Comments 2
In the health sector, why do you prefer XLV rather than Vanguard’s VHT? VHT seems to give equal to better performance, its yield is 1.85% vs. XLV’s 1.39%, annual expense ration is 0.09% vs. XLV’s 0.15%, and even the P/E is better, 21 vs. 23 — according to the info on Yahoo Finance.
XLV came up as the better choice when I set up the 10 ETFs in the Spotlight. One of the main criteria was less volatility, which I measure via my proprietary MaxDD%. Another reason was far better average volume. If you prefer using VHT, there is nothing wrong with that.
Ulli…