
1. Moving the Markets
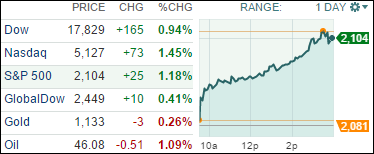
U.S. stocks kicked off November with nice rally as investors reacted to a batch of corporate deals, fresh economic data and anticipate another big week of corporate earnings. For first time since Aug. 18 the S&P 500 closed above 2100. The index is now at 2104.05 nearing its all-time closing high of 2130.82.
In earnings news, shares of Mexican chain Chipotle Mexican Grill (CMG) ended down 2.5% after the company closed some restaurants out West in response to reports of suspected E-coli infection traced to its restaurants in Washington and Oregon.
After watching our Domestic Trend Tracking Index (TTI) hover slightly above its long-term trend line for 6 consecutive days, today’s breakout confirms the newly developed trend, which makes a new Buy signal for “broadly diversified domestic equity funds/ETFs” effective as of tomorrow. As the rally gained steam, I took the opportunity early this morning to add to some of our sector positions, which I established last week. For more details, please see section 3 below.
Equities were mixed around the globe. Shares in China and Hong Kong were dragged down by the weak manufacturing data out of mainland China, with its so-called PMI coming in line with forecasts at 49.8, which signals a contraction.
All of our 10 ETFs in the Spotlight joined the rally and closed higher led by Healthcare (XLV) with +2.04%, while Consumer Discretionaries (XLY) lagged with +0.46%.
2. ETFs in the Spotlight
In case you missed the announcement and description of this section, you can read it here again.
It features 10 broadly diversified ETFs from my HighVolume list as posted every Monday. Furthermore, they are screened for the lowest MaxDD% number meaning they have been showing better resistance to temporary sell offs than all others over the past year.
Here are the 10 candidates:
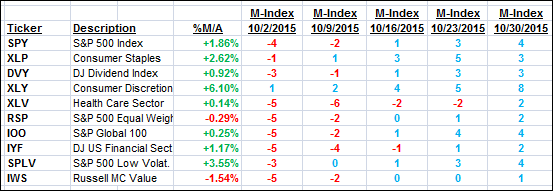
The above table simply demonstrates the magnitude with which some of the ETFs are fluctuating in regards to their positions above or below their respective individual trend lines (%M/A). A break below, represented by a negative number, shows weakness, while a break above, represented by a positive percentage, shows strength.
For hundreds of ETF/Mutual fund choices, be sure to reference Thursday’s StatSheet.
Year to date, here’s how the above candidates have fared so far:
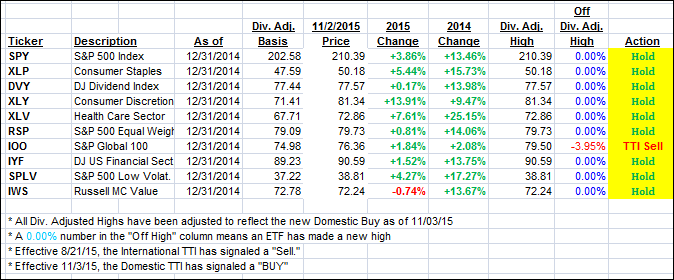
Again, the first table above shows the position of the various ETFs in relation to their respective long term trend lines (%M/A), while the second one tracks their trailing sell stops in the “Off High” column. The “Action” column will signal a “Sell” once the -7.5% point has been taken out in the “Off High” column.
3. Trend Tracking Indexes (TTIs)
Our Domestic Trend Tracking Index (TTI) has now shown 6 days of staying power above its respective trend line and, with today’s rally, has broken out of its tight trading range generating a new Buy signal for “broadly diversified domestic equity funds/ETFs.” For tracking purposes, the effective date will be 11/3/15.
A Sell signal will be generated once the Domestic TTI clearly breaks down below its trend line again. Internationally, we remain in bearish territory.
Here’s how we closed:
Domestic TTI: +0.74% (last Friday +0.24%)—Buy signal effective 11/3/2015
International TTI: -2.05% (last Friday -2.76%)—Sell signal effective 8/21/2015
Disclosure: I am obliged to inform you that I, as well as advisory clients of mine, own some of these listed ETFs. Furthermore, they do not represent a specific investment recommendation for you, they merely show which ETFs from the universe I track are falling within the guidelines specified.
Contact Ulli