
1. Moving the Markets
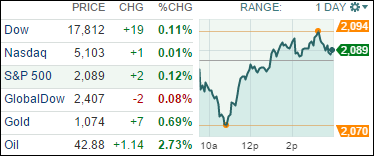
The 3 major u.s. benchmarks eked out small gains today by the closing bell, as geopolitical risk weighed on financial markets. The shooting of a Russian fighter jet by turkey entrenched the post-paris terrorism threat and coming interest rate hikes on wall street’s worry list today.
The latest geopolitical flash drove stock prices down in Europe and in early trading in the U.S. and sparked a rally in oil, which set off a flight to safe-haven assets, such as U.S. and German government bonds. The sharp drop early on did not last, and the indexes slowly climbed out of a deep hole; in my view only because of seasonal tendencies as economic data was questionable to say the least.
In the tech world, we heard from Hewlett Packard (HPQ) today that revenue for the two-tiered organization in Q4 was down, year over year, and profits were at the low end of analysts’ estimates, which may reaffirm the necessity for the 76-year-old computing pioneer’s recent split. The combined company has reported a revenue decline in 16 of the past 17 quarters. Since the official split more than three weeks ago, HPE shares have tumbled 8% to $13.85. Shares of (HPQ), which sells PCs and printers, have surged 16% to $14.23.
7 of our 10 ETFs in the Spotlight edged higher and 3 closed down. Leading on the plus side was the Mid-Cap Value (IWS) with +0.42%. Slipping the most was the Low Volatility S&P (SPLV) with -0.28%.
2. ETFs in the Spotlight
In case you missed the announcement and description of this section, you can read it here again.
It features 10 broadly diversified ETFs from my HighVolume list as posted every Monday. Furthermore, they are screened for the lowest MaxDD% number meaning they have been showing better resistance to temporary sell offs than all others over the past year.
Here are the 10 candidates:
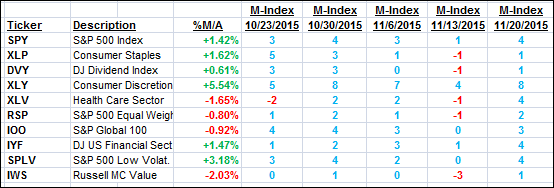
The above table simply demonstrates the magnitude with which some of the ETFs are fluctuating in regards to their positions above or below their respective individual trend lines (%M/A). A break below, represented by a negative number, shows weakness, while a break above, represented by a positive percentage, shows strength.
For hundreds of ETF/Mutual fund choices, be sure to reference Thursday’s StatSheet.
Year to date, here’s how the above candidates have fared so far:
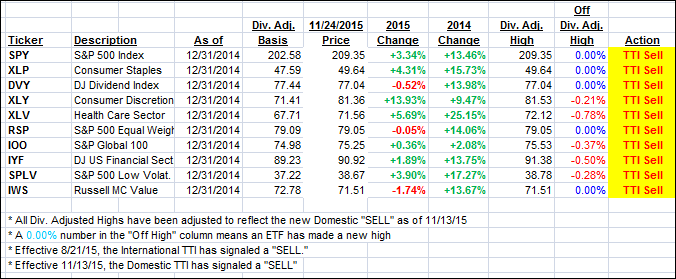
Again, the first table above shows the position of the various ETFs in relation to their respective long term trend lines (%M/A), while the second one tracks their trailing sell stops in the “Off High” column. The “Action” column will signal a “Sell” once the -7.5% point has been taken out in the “Off High” column.
3. Trend Tracking Indexes (TTIs)
Our Domestic Trend Tracking Index (TTI) again changed only slightly and not enough to make a difference to our current bearish view of the markets.
Here’s how we closed:
Domestic TTI: +0.54% (last close +0.46%)—Sell signal effective 11/13/2015
International TTI: -3.45% (last close -3.27%)—Sell signal effective 8/21/2015
Disclosure: I am obliged to inform you that I, as well as advisory clients of mine, own some of these listed ETFs. Furthermore, they do not represent a specific investment recommendation for you, they merely show which ETFs from the universe I track are falling within the guidelines specified.
Contact Ulli