
1. Moving the Markets
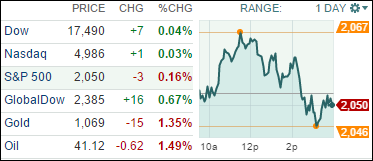
An early follow through rally from yesterday ran into resistance despite strong earnings from Wal-Mart and Home Depot. Falling oil prices and the evacuation of a soccer stadium in Germany, rekindling more terror fears, proved to be too much of a negative.
Other data offered a mixed view of the U.S. economy with consumer prices increasing (after declining for 2 straight months) and industrial production falling. Of course, every upcoming data point is dissected to see if it might affect the Fed’s decision on interest rates in December.
3 of our 10 ETFs in the Spotlight eked out a gain today led by Healthcare (XLV) with +0.43%. On the loser’s side, the Dividend ETF (DVY) took dubious honors by dropping -0.91%.
2. ETFs in the Spotlight
In case you missed the announcement and description of this section, you can read it here again.
It features 10 broadly diversified ETFs from my HighVolume list as posted every Monday. Furthermore, they are screened for the lowest MaxDD% number meaning they have been showing better resistance to temporary sell offs than all others over the past year.
Here are the 10 candidates:
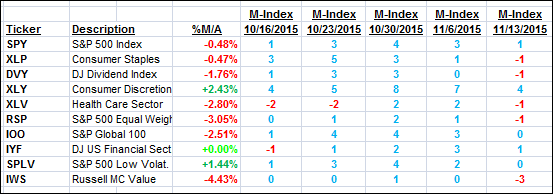
The above table simply demonstrates the magnitude with which some of the ETFs are fluctuating in regards to their positions above or below their respective individual trend lines (%M/A). A break below, represented by a negative number, shows weakness, while a break above, represented by a positive percentage, shows strength.
For hundreds of ETF/Mutual fund choices, be sure to reference Thursday’s StatSheet.
Year to date, here’s how the above candidates have fared so far:
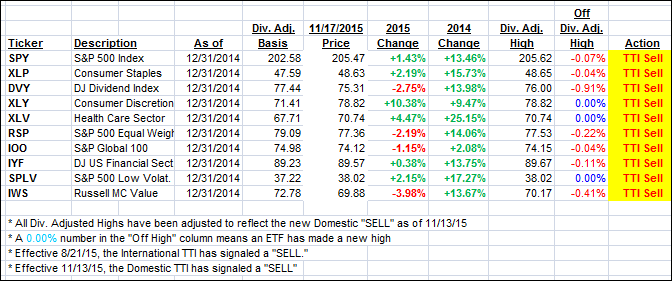
Again, the first table above shows the position of the various ETFs in relation to their respective long term trend lines (%M/A), while the second one tracks their trailing sell stops in the “Off High” column. The “Action” column will signal a “Sell” once the -7.5% point has been taken out in the “Off High” column.
3. Trend Tracking Indexes (TTIs)
Our Domestic Trend Tracking Index (TTI) changed only immaterially with no effect on our current bearish position.
Here’s how we closed:
Domestic TTI: -0.52% (last close -0.51%)—Sell signal effective 11/13/2015
International TTI: -4.32% (last close -4.53%)—Sell signal effective 8/21/2015
Disclosure: I am obliged to inform you that I, as well as advisory clients of mine, own some of these listed ETFs. Furthermore, they do not represent a specific investment recommendation for you, they merely show which ETFs from the universe I track are falling within the guidelines specified.
Contact Ulli