
1. Moving the Markets
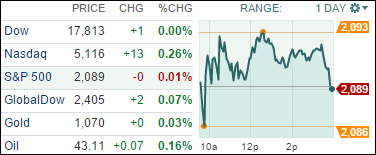
It was a slow pre-Holiday session with the major indexes trending to the upside intraday but ending just about unchanged. Volume was extremely low.
Economic data were mixed but Wall Street still believes that the Fed remains on track to raise rates. All eyes are on next week’s jobs report which, should it come in better than expected (200,000), may turn out to be the final nail in the interest rate coffin.
The markets will be open this Friday for a half-day session.
6 of our 10 ETFs in the Spotlight squeezed out a gain in this non-directional session. Leading to the upside was Healthcare (XLV) with +0.54%, while the Global 100 (IOO) slipped -0.09%.
2. ETFs in the Spotlight
In case you missed the announcement and description of this section, you can read it here again.
It features 10 broadly diversified ETFs from my HighVolume list as posted every Monday. Furthermore, they are screened for the lowest MaxDD% number meaning they have been showing better resistance to temporary sell offs than all others over the past year.
Here are the 10 candidates:
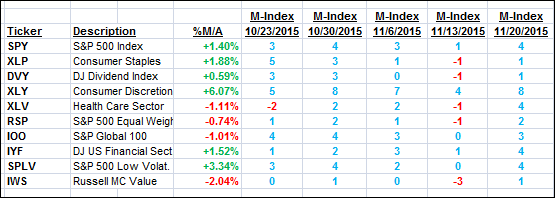
The above table simply demonstrates the magnitude with which some of the ETFs are fluctuating in regards to their positions above or below their respective individual trend lines (%M/A). A break below, represented by a negative number, shows weakness, while a break above, represented by a positive percentage, shows strength.
For hundreds of ETF/Mutual fund choices, be sure to reference Thursday’s StatSheet.
Year to date, here’s how the above candidates have fared so far:
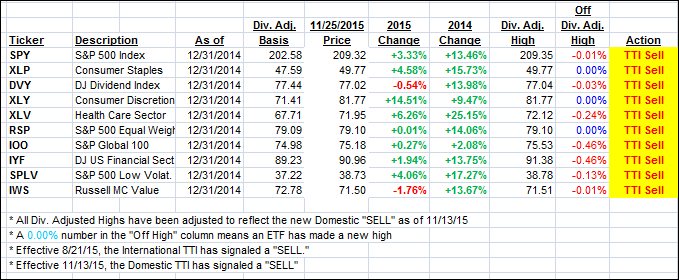
Again, the first table above shows the position of the various ETFs in relation to their respective long term trend lines (%M/A), while the second one tracks their trailing sell stops in the “Off High” column. The “Action” column will signal a “Sell” once the -7.5% point has been taken out in the “Off High” column.
3. Trend Tracking Indexes (TTIs)
Our Domestic Trend Tracking Index (TTI) did another repeat of the past couple of days by changing only slightly. The current break above the line is not enough yet to make a difference in our current bearish view of the markets.
Here’s how we closed:
Domestic TTI: +0.67% (last close +0.54%)—Sell signal effective 11/13/2015
International TTI: -3.18% (last close -3.45%)—Sell signal effective 8/21/2015
Enjoy the Thanksgiving Holiday!
Disclosure: I am obliged to inform you that I, as well as advisory clients of mine, own some of these listed ETFs. Furthermore, they do not represent a specific investment recommendation for you, they merely show which ETFs from the universe I track are falling within the guidelines specified.
Contact Ulli