
1. Moving the Markets
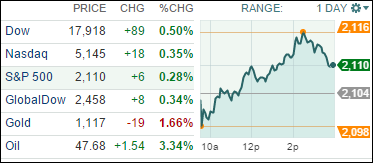
Stocks gained as Wall Street continued trucking higher on the previous day’s rally that sent the Dow back into the black for the year. Traders focused mostly on more earnings reports and corporate deals as they debated whether Monday’s stock market surge was the start of a lasting year-end rally.
Equities, which appeared to be on the brink of a major slump this summer, witnessed by a 10% drop, have rebounded sharply this fall. Driving the rebound has been a mix of better-than-expected corporate earnings, the Fed holding off on interest rate hikes and signs that China’s economy, while slowing, is not collapsing.
On the earnings front, insurer AIG (AIG), which activist investor Carl Icahn argues should split into three separate parts, fell short of earnings expectations. Shares of the company were down 4% to $60.99. We also heard today, that shares of cereal maker Kellogg (K) fell 3% to $68.38 after it reported quarterly sales that fell short of analyst estimates.
In auto tech, Tesla Motors (TSLA) beat analyst earnings estimates today for its third quarter, saying that it is beating production targets. However, the electric car maker reported losing 58 cents a share on an adjusted basis, or $75 million. Investors are lying in wait to see how the new ‘more affordable’ model will take off in 2016.
7 of our 10 ETFs in the Spotlight closed up and 3 closed down. Sporting the best gain was Consumer Discretionaries (XLY) with +0.38%, while the loser of the day was the Low Volatility S&P ETF (SPLV), which gave back -0.64%.
2. ETFs in the Spotlight
In case you missed the announcement and description of this section, you can read it here again.
It features 10 broadly diversified ETFs from my HighVolume list as posted every Monday. Furthermore, they are screened for the lowest MaxDD% number meaning they have been showing better resistance to temporary sell offs than all others over the past year.
Here are the 10 candidates:
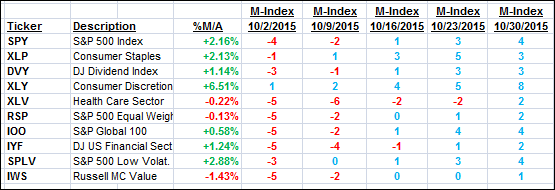
The above table simply demonstrates the magnitude with which some of the ETFs are fluctuating in regards to their positions above or below their respective individual trend lines (%M/A). A break below, represented by a negative number, shows weakness, while a break above, represented by a positive percentage, shows strength.
For hundreds of ETF/Mutual fund choices, be sure to reference Thursday’s StatSheet.
Year to date, here’s how the above candidates have fared so far:
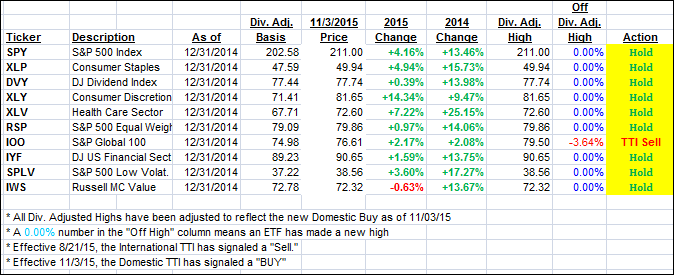
Again, the first table above shows the position of the various ETFs in relation to their respective long term trend lines (%M/A), while the second one tracks their trailing sell stops in the “Off High” column. The “Action” column will signal a “Sell” once the -7.5% point has been taken out in the “Off High” column.
3. Trend Tracking Indexes (TTIs)
Our Trend Tracking Indexes (TTIs) continue to present a mixed picture with the Domestic one now in “Buy” mode while the International one remains stuck on the bearish side of its respective trend line.
A Sell signal will be generated once the Domestic TTI clearly breaks down below its trend line again.
Here’s how we ended up:
Domestic TTI: +0.84% (last Friday +0.24%)—Buy signal effective 11/3/2015
International TTI: -1.97% (last Friday -2.76%)—Sell signal effective 8/21/2015
Disclosure: I am obliged to inform you that I, as well as advisory clients of mine, own some of these listed ETFs. Furthermore, they do not represent a specific investment recommendation for you, they merely show which ETFs from the universe I track are falling within the guidelines specified.
Contact Ulli