
1. Moving the Markets
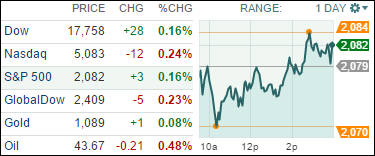
Today was a relatively lackluster scene on Wall Street, wherein the Nasdaq finished a bit lower and the S&P 500 and Dow a bit higher.
Apple (AAPL) moved markets a bit early on in the day, shortly after a report was released from Credit Suisse which hinted that the company has decreased its number of orders for the iPhone by about 10%.
Economic data was a bit limited today and focused primarily on the import and export prices, and Crude oil. Crude oil rallied to $44.70 a barrel about halfway through the day, after a report by the IEA that projected prices of the black gold moving back up to around $80 a barrel by 2020. The increase in consumption, of course, is due to rising demand from China and India.
There was an interesting bit of news on the telecommunications front today from T-Mobile (TMUS). The company announced a new program that will allow customers to watch video online without it counting towards data consumption, starting November 15. Investors had mixed reactions to the news it seems, as the stock closed about $1.53 lower.
9 of our 10 ETFs in the Spotlight managed to gain as Consumer Discretionaries (XLY) took the lead with +0.95%. The loser of the day was the Global 100 (IOO) with -0.36%.
2. ETFs in the Spotlight
In case you missed the announcement and description of this section, you can read it here again.
It features 10 broadly diversified ETFs from my HighVolume list as posted every Monday. Furthermore, they are screened for the lowest MaxDD% number meaning they have been showing better resistance to temporary sell offs than all others over the past year.
Here are the 10 candidates:
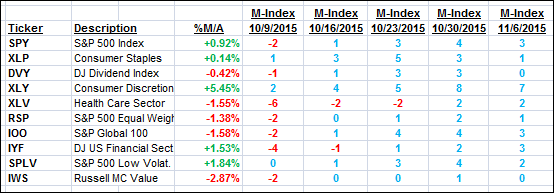
The above table simply demonstrates the magnitude with which some of the ETFs are fluctuating in regards to their positions above or below their respective individual trend lines (%M/A). A break below, represented by a negative number, shows weakness, while a break above, represented by a positive percentage, shows strength.
For hundreds of ETF/Mutual fund choices, be sure to reference Thursday’s StatSheet.
Year to date, here’s how the above candidates have fared so far:
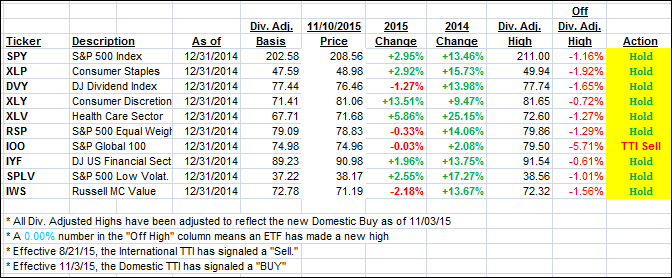
Again, the first table above shows the position of the various ETFs in relation to their respective long term trend lines (%M/A), while the second one tracks their trailing sell stops in the “Off High” column. The “Action” column will signal a “Sell” once the -7.5% point has been taken out in the “Off High” column.
3. Trend Tracking Indexes (TTIs)
Our Domestic Trend Tracking Index (TTI) recovered and closed back abobve its trend line. We remain bullish until a clear and sustained break below the line occurs.
Here’s how we closed the day:
Domestic TTI: +0.11% (last close -0.01%)—Buy signal effective 11/3/2015
International TTI: -3.46% (last close -3.31%)—Sell signal effective 8/21/2015
Disclosure: I am obliged to inform you that I, as well as advisory clients of mine, own some of these listed ETFs. Furthermore, they do not represent a specific investment recommendation for you, they merely show which ETFs from the universe I track are falling within the guidelines specified.
Contact Ulli