
1. Moving the Markets
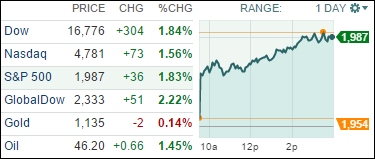
Stocks kicked off the week in rally mode Monday as investors view a Federal Reserve interest rate hike this year as less likely after Friday’s weak jobs report raised questions about the pace of U.S. growth.
Third quarter earnings season kicks off this week when Alcoa (AA) reports on Thursday. Analysts are predicting a decline of 4.8% for S&P 500 companies, which would be the first quarter-over-quarter profit decline since 2009.
The culprit for market declines is largely pointing towards the energy sector. Companies in the energy sector are expected to post 60% lower profits for Q3, which is mainly due to a 50% drop in oil prices from this time last year. Don’t let these numbers fool you though, because energy companies skew the numbers. Excluding energy sector stocks, corporate profits are on track to be growing 3.5%, according to S&P capital IQ.
In other corporate news, we heard today that American Apparel (APP) has filed for bankruptcy, after its made-in-the-U.S. model faltered, its fashion sense slipped and its controversial former CEO became embroiled in scandal over his behavior in the workplace. The company, which flirted with bankruptcy as early as 2011, has about 8,500 employees at six factories and 230 stores in the U.S. and 17 and it famously bet its business model on clothing made in the U.S.
Continuing Friday’s theme, all of our 10 ETFs in the Spotlight rallied and closed higher with the leader being the MidCap Value (IWS), which added +2.14%. The laggard for the day was Healthcare (XLV) with +0.26%.
2. ETFs in the Spotlight
In case you missed the announcement and description of this section, you can read it here again.
It features 10 broadly diversified ETFs from my HighVolume list as posted every Monday. Furthermore, they are screened for the lowest MaxDD% number meaning they have been showing better resistance to temporary sell offs than all others over the past year.
Here are the 10 candidates:
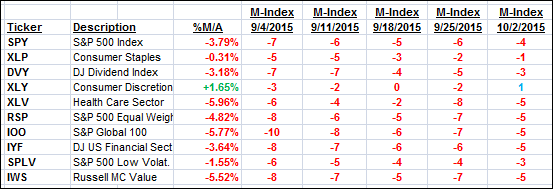
The above table simply demonstrates the magnitude with which some of the ETFs are fluctuating in regards to their positions above or below their respective individual trend lines (%M/A). A break below, represented by a negative number, shows weakness, while a break above, represented by a positive percentage, shows strength.
For hundreds of ETF/Mutual fund choices, be sure to reference Thursday’s StatSheet.
Year to date, here’s how the above candidates have fared so far:
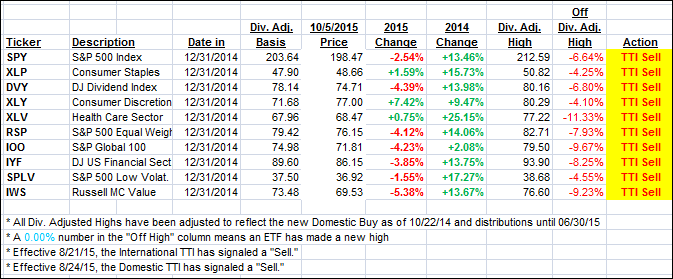
Again, the first table above shows the position of the various ETFs in relation to their respective long term trend lines (%M/A), while the second one tracks their trailing sell stops in the “Off High” column. The “Action” column will signal a “Sell” once the -7.5% point has been taken out in the “Off High” column.
3. Trend Tracking Indexes (TTIs)
Our Trend Tracking Indexes (TTIs) improved again but still remain on the bearish side of their trend lines by the following percentages:
Domestic TTI: -1.31% (last close -1.90%)—Sell signal effective 8/24/2015
International TTI: -5.37% (last close -6.67%)—Sell signal effective 8/21/2015
Until the respective trend lines get clearly broken to the upside, we are staying on the sidelines.
Disclosure: I am obliged to inform you that I, as well as advisory clients of mine, own some of these listed ETFs. Furthermore, they do not represent a specific investment recommendation for you, they merely show which ETFs from the universe I track are falling within the guidelines specified.
Contact Ulli