
1. Moving the Markets
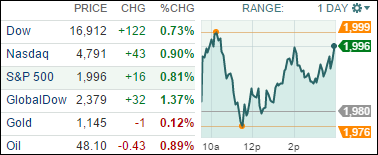
After nosing into the red in late-morning trading, all three major benchmarks climbed back into the black to close the day. Analysts are eyeing the key 2000 level on the S&P 500 index, as that level now is viewed as a ceiling of sorts for stocks as they look to rebound further. A break above 2000 would boost hopes that the uptrend that began Friday has legs and that the market is regaining its bullish stance.
Today, traders were also bracing for the unofficial start of the third-quarter earnings season, which kicks off with very low expectations Thursday when aluminum maker Alcoa (AA) reports. For the third straight month, the profit-reporting season begins with Wall Street analysts predicting a contraction in earnings.
A possible market-moving event occurs Thursday, when the Fed releases the minutes of its September meeting. Stocks, of course, have been hurt by uncertainty surrounding the start of rate hikes, but have recently gotten a boost after Friday’s weak jobs report resulted in Wall Street pushing out the so-called Fed “lift-off” into early 2016.
It was a wild ride, but all of our 10 ETFs in the Spotlight participated in the reboud and closed higher. The leader of the day was Healthcare (XLV), which added +1.53%. Lagging the group was Consumer Discretionaries (XLY) with +0.31%.
2. ETFs in the Spotlight
In case you missed the announcement and description of this section, you can read it here again.
It features 10 broadly diversified ETFs from my HighVolume list as posted every Monday. Furthermore, they are screened for the lowest MaxDD% number meaning they have been showing better resistance to temporary sell offs than all others over the past year.
Here are the 10 candidates:
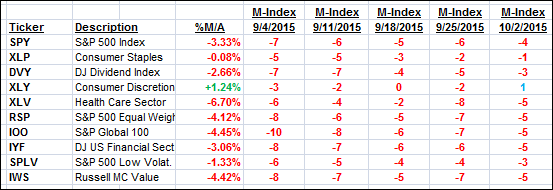
The above table simply demonstrates the magnitude with which some of the ETFs are fluctuating in regards to their positions above or below their respective individual trend lines (%M/A). A break below, represented by a negative number, shows weakness, while a break above, represented by a positive percentage, shows strength.
For hundreds of ETF/Mutual fund choices, be sure to reference Thursday’s StatSheet.
Year to date, here’s how the above candidates have fared so far:
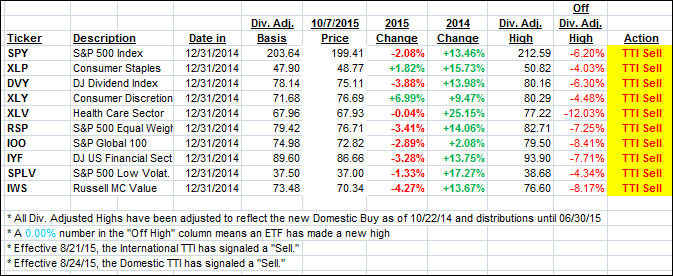
Again, the first table above shows the position of the various ETFs in relation to their respective long term trend lines (%M/A), while the second one tracks their trailing sell stops in the “Off High” column. The “Action” column will signal a “Sell” once the -7.5% point has been taken out in the “Off High” column.
3. Trend Tracking Indexes (TTIs)
Our Trend Tracking Indexes (TTIs) improved and moved closer to their trend lines.
Here’s how we closed:
Domestic TTI: -1.21% (last close -1.57%)—Sell signal effective 8/24/2015
International TTI: -4.26% (last close -5.16%)—Sell signal effective 8/21/2015
Until the respective trend lines get clearly broken to the upside, we are staying on the sidelines.
Disclosure: I am obliged to inform you that I, as well as advisory clients of mine, own some of these listed ETFs. Furthermore, they do not represent a specific investment recommendation for you, they merely show which ETFs from the universe I track are falling within the guidelines specified.
Contact Ulli