
1. Moving the Markets
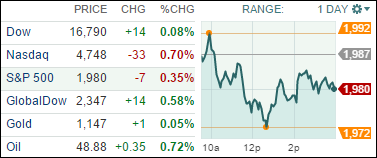
After a strong five-day rally that lifted the major U.S. stock indexes well off their lows hit in August, equities ended mixed as Wall Street reassessed the outlook for stocks for the rest of 2015.
Healthcare stocks led the decline in the S&P, while a rally in Dupont’s stock (DD) helped keep the Dow in positive territory. Healthcare stocks have had a tough year that is mostly due to the widespread scrutiny over high prices for pharmaceuticals.
Investors are still anxious in waiting for the earnings season to kick off later this week. At present, expectations are low, but many analysts think that this could actually be beneficial for the indexes if stocks outperform. It is a critical time to see how the markets will react to earnings reports, especially since the S&P 500 keeps flirting with the 10% correction status.
And in economic news, we heard today that the U.S. trade deficit jumped sharply in August as exports fell to the lowest level in nearly three years while imports increased, led by a surge in shipments of cellphones from China. The deficit increased 15.6% to $48.3 billion, the biggest since March, the Commerce Department reported Tuesday.
Only 2 of our 10 ETFs in the Spotlight managed to eke out a gain with the Global 100 (IOO) taking the top spot by adding +0.42%. The loser of the day turned out to be Healthcare (XLV) which got clobbered at the tune of -2.35%. Ouch.
2. ETFs in the Spotlight
In case you missed the announcement and description of this section, you can read it here again.
It features 10 broadly diversified ETFs from my HighVolume list as posted every Monday. Furthermore, they are screened for the lowest MaxDD% number meaning they have been showing better resistance to temporary sell offs than all others over the past year.
Here are the 10 candidates:
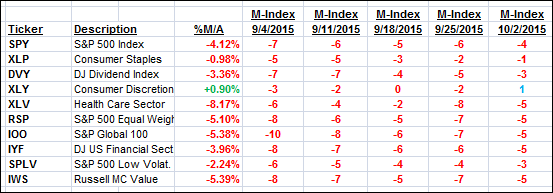
The above table simply demonstrates the magnitude with which some of the ETFs are fluctuating in regards to their positions above or below their respective individual trend lines (%M/A). A break below, represented by a negative number, shows weakness, while a break above, represented by a positive percentage, shows strength.
For hundreds of ETF/Mutual fund choices, be sure to reference Thursday’s StatSheet.
Year to date, here’s how the above candidates have fared so far:
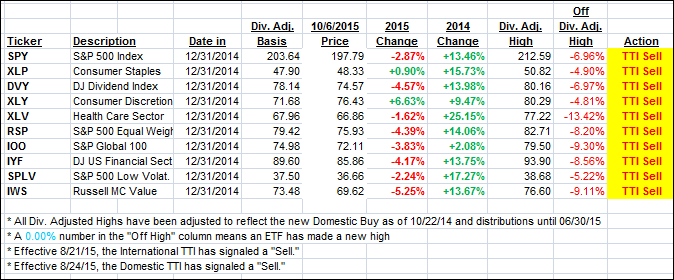
Again, the first table above shows the position of the various ETFs in relation to their respective long term trend lines (%M/A), while the second one tracks their trailing sell stops in the “Off High” column. The “Action” column will signal a “Sell” once the -7.5% point has been taken out in the “Off High” column.
3. Trend Tracking Indexes (TTIs)
Our Trend Tracking Indexes (TTIs) were mixed today with the Domestic one slipping while the International one improved slightly.
Here’s how we ended up:
Domestic TTI: -1.57% (last close -1.31%)—Sell signal effective 8/24/2015
International TTI: -5.16% (last close -5.37%)—Sell signal effective 8/21/2015
Until the respective trend lines get clearly broken to the upside, we are staying on the sidelines.
Disclosure: I am obliged to inform you that I, as well as advisory clients of mine, own some of these listed ETFs. Furthermore, they do not represent a specific investment recommendation for you, they merely show which ETFs from the universe I track are falling within the guidelines specified.
Contact Ulli