
1. Moving the Markets
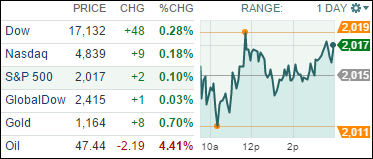
The Dow Jones industrial average, coming off its biggest weekly gain since February, ended modestly higher to post its seventh-straight session of gains as Wall Street awaited the barrage of corporate earnings reports, which begin tomorrow. The S&P 500 and Nasdaq both performed well today also.
The question remains: “Is this a new bull market or a bear market bounce?” While there are many viewpoints, I believe that until we actually see a crossing of our Domestic Trend Tracking Index (TTI) into bullish territory, this is nothing but a dead cat bounce, although one of great magnitude. Only time will tell whether a new bullish cycle is in the making.
Wall Street was also digesting a big deal in the tech sector, where Dell (DELL) teamed up with MSD a private equity firm Silver Lake to purchase data storage player EMC for $33.15 per share in a blockbuster cash and stock deal valued at more than $67 billion. The deal is notching its place in history as the biggest ever in the tech sector.
As I mentioned last week, most investors are anxiously awaiting corporate earnings this week from some of the big financial institutions, such as JP Morgan (JPM), Wells Fargo (WFC), Citigroup (C) and Bank of America (BAML). We will hear from Johnson & Johnson (JNJ) and Intel (INTC) on Tuesday.
7 of our 10 ETFs in the Spotlight headed north with the leader being Consumer Discretionaries (XLY) at +0.48%. On the downside, Mid-Cap Value (IWS) lost a scant -0.24%.
2. ETFs in the Spotlight
In case you missed the announcement and description of this section, you can read it here again.
It features 10 broadly diversified ETFs from my HighVolume list as posted every Monday. Furthermore, they are screened for the lowest MaxDD% number meaning they have been showing better resistance to temporary sell offs than all others over the past year.
Here are the 10 candidates:
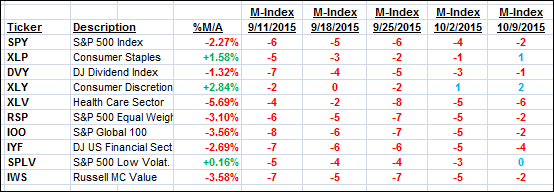
The above table simply demonstrates the magnitude with which some of the ETFs are fluctuating in regards to their positions above or below their respective individual trend lines (%M/A). A break below, represented by a negative number, shows weakness, while a break above, represented by a positive percentage, shows strength.
For hundreds of ETF/Mutual fund choices, be sure to reference Thursday’s StatSheet.
Year to date, here’s how the above candidates have fared so far:
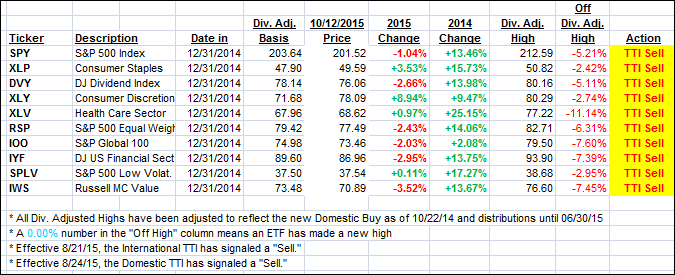
Again, the first table above shows the position of the various ETFs in relation to their respective long term trend lines (%M/A), while the second one tracks their trailing sell stops in the “Off High” column. The “Action” column will signal a “Sell” once the -7.5% point has been taken out in the “Off High” column.
3. Trend Tracking Indexes (TTIs)
Our Trend Tracking Indexes (TTIs) changed only slightly with no effect on our current bearish view.
Here’s how we closed:
Domestic TTI: -0.61% (last close -0.77%)—Sell signal effective 8/24/2015
International TTI: -3.33% (last close -3.34%)—Sell signal effective 8/21/2015
Until the respective trend lines get clearly broken to the upside, we are staying on the sidelines.
Disclosure: I am obliged to inform you that I, as well as advisory clients of mine, own some of these listed ETFs. Furthermore, they do not represent a specific investment recommendation for you, they merely show which ETFs from the universe I track are falling within the guidelines specified.
Contact Ulli