
1. Moving the Markets
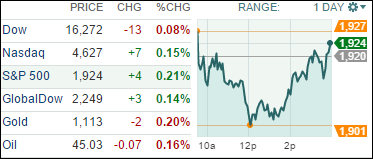
Stocks ended mixed after cutting early losses as Wall Street kicked off the fourth quarter with investors struggling to put the worst quarterly decline in four years behind them.
Wall Street is heading into the final three months of the year still trying to gauge the impact of a slowing economy in China and the impact of coming interest rate hikes on assets ranging from stocks to bonds to commodities. Most investors are waiting for positive signs on both fronts.
In economic news, data showed U.S. manufacturing growth stagnated in September, weighed down by a stronger dollar and weaker overseas demand. A separate report showed that the number of Americans filing for unemployment benefits rose last week, while the overall trend still reflects a strengthening labor market. U.S. Treasuries were lower today.
5 of our 10 ETFs in the Spotlight managed to close higher during this see-saw day. Healthcare (XLV) took top billing with +1.01%, while the Dividend ETF (DVY) did not fare well and lost -0.63%.
2. ETFs in the Spotlight
In case you missed the announcement and description of this section, you can read it here again.
It features 10 broadly diversified ETFs from my HighVolume list as posted every Monday. Furthermore, they are screened for the lowest MaxDD% number meaning they have been showing better resistance to temporary sell offs than all others over the past year.
Here are the 10 candidates:
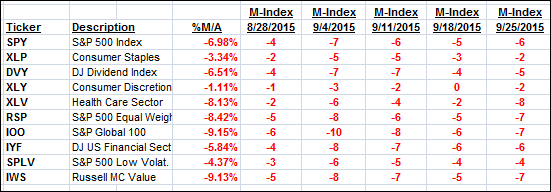
The above table simply demonstrates the magnitude with which some of the ETFs are fluctuating in regards to their positions above or below their respective individual trend lines (%M/A). A break below, represented by a negative number, shows weakness, while a break above, represented by a positive percentage, shows strength.
For hundreds of ETF/Mutual fund choices, be sure to reference Thursday’s StatSheet.
Year to date, here’s how the above candidates have fared so far:
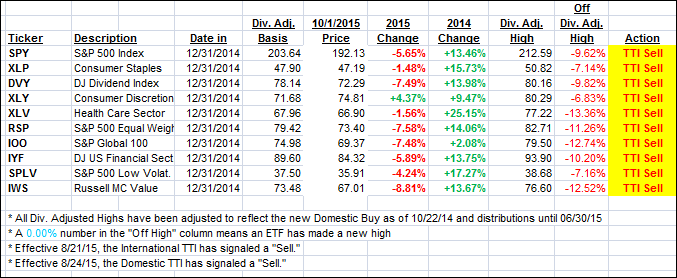
Again, the first table above shows the position of the various ETFs in relation to their respective long term trend lines (%M/A), while the second one tracks their trailing sell stops in the “Off High” column. The “Action” column will signal a “Sell” once the -7.5% point has been taken out in the “Off High” column.
3. Trend Tracking Indexes (TTIs)
Our Trend Tracking Indexes (TTIs) slipped a bit and closed as follows:
Domestic TTI: -2.65% (last close -2.79%)—Sell signal effective 8/24/2015
International TTI: -7.96% (last close -8.30%)—Sell signal effective 8/21/2015
Until the respective trend lines get clearly broken to the upside, we are staying on the sidelines.
Disclosure: I am obliged to inform you that I, as well as advisory clients of mine, own some of these listed ETFs. Furthermore, they do not represent a specific investment recommendation for you, they merely show which ETFs from the universe I track are falling within the guidelines specified.
Contact Ulli