
1. Moving the Markets
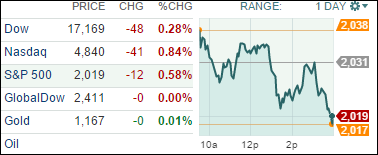
After suffering mild losses the day before, U.S. stocks fell deeper in the red today as traders encountered another big day of earnings reports, with blue chip names Coca-Cola, Boeing, American Express and General Motors releasing third-quarter results.
In earnings news, Coca-Cola (KO) profit fell in the third quarter but earnings still slightly beat estimates. Shares dropped slightly. Shares of Boeing (BA) jumped 1.8% after reporting earnings that beat Wall Street expectations and raised its profit outlook for the year. Valeant Pharmaceuticals (VRX) hurtled downward, losing around 19.2%, on an investment group’s report claiming that the company is inflating drug sales through bogus transactions. Both Chipotle (CMG) and Yahoo (YHOO) shares tumbled today after both showed earnings that fell short of Wall Street expectations.
In the IPO world, luxury automaker Ferrari (RACE) went public today. In a sign of optimism, shares of its initial public offering were priced at $52 a share, which is the top of the $48 to $52 range analysts were predicting. Shares opened trading today at $60 a share this morning and closed at $55 a share.
Only 1 of our 10 ETFs in the Spotlight managed to squeeze out a gain, namely Consumer Staples (XLP) with a scant +0.02%. Leading the losers was the Mid-Cap Value ETF (IWS), which gave back -1.00%.
2. ETFs in the Spotlight
In case you missed the announcement and description of this section, you can read it here again.
It features 10 broadly diversified ETFs from my HighVolume list as posted every Monday. Furthermore, they are screened for the lowest MaxDD% number meaning they have been showing better resistance to temporary sell offs than all others over the past year.
Here are the 10 candidates:
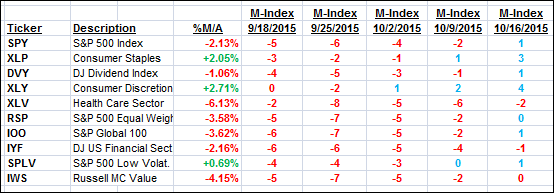
The above table simply demonstrates the magnitude with which some of the ETFs are fluctuating in regards to their positions above or below their respective individual trend lines (%M/A). A break below, represented by a negative number, shows weakness, while a break above, represented by a positive percentage, shows strength.
For hundreds of ETF/Mutual fund choices, be sure to reference Thursday’s StatSheet.
Year to date, here’s how the above candidates have fared so far:
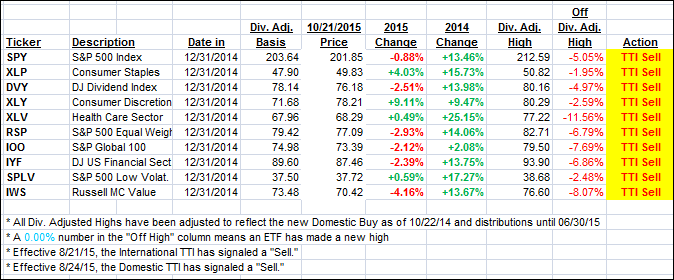
Again, the first table above shows the position of the various ETFs in relation to their respective long term trend lines (%M/A), while the second one tracks their trailing sell stops in the “Off High” column. The “Action” column will signal a “Sell” once the -7.5% point has been taken out in the “Off High” column.
3. Trend Tracking Indexes (TTIs)
Our Trend Tracking Indexes (TTIs) headed moderately south and ended the day just bit deeper on the bearish side of their trend lines:
Domestic TTI: -0.87% (last close -0.49%)—Sell signal effective 8/24/2015
International TTI: -4.05% (last close -3.78%)—Sell signal effective 8/21/2015
Until the respective trend lines get clearly broken to the upside, we are staying on the sidelines.
Disclosure: I am obliged to inform you that I, as well as advisory clients of mine, own some of these listed ETFs. Furthermore, they do not represent a specific investment recommendation for you, they merely show which ETFs from the universe I track are falling within the guidelines specified.
Contact Ulli