
1. Moving the Markets
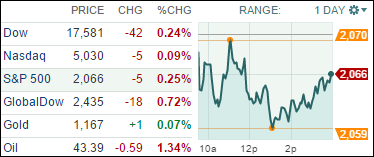
Stocks dipped as investors awaited a Federal Reserve decision Wednesday on interest rates and Apple’s earnings report after the closing bell. Disappointing economic data on manufacturing and consumer confidence also weighed on markets. Energy stocks led the decliners as oil prices fell. A barrel of U.S. crude was down 2.2% to $43.03.
Investors are in wait-and-see mode as the Fed kicks off a two-day meeting Tuesday, which could shed light on whether the nation’s central bank will hike interest rates this year for the first time in nearly 10 years. Wall Street is not expecting a hike at this meeting, but will be looking for clues as to whether the Fed will pull the trigger at its last meeting of the year in December.
Still to come this week, Wall Street pros will be closely watching the profit report from iPhone and iPad maker Apple (AAPL) after today’s closing bell. The world’s most-valuable company has seen its stock gains trail other big tech names, such as search-giant Google parent Alphabet (GOOG) and online retail giant Amazon.com (AMZN).
Again, 2 of our 10 ETFs in the Spotlight bucked the trend and closed higher. Leading the charge to the upside was Healthcare (XLV) with +1.81% while on the downside, the Global 100 (IOO) and the Mid-Cap Value (IWS) lost -0.75%.
2. ETFs in the Spotlight
In case you missed the announcement and description of this section, you can read it here again.
It features 10 broadly diversified ETFs from my HighVolume list as posted every Monday. Furthermore, they are screened for the lowest MaxDD% number meaning they have been showing better resistance to temporary sell offs than all others over the past year.
Here are the 10 candidates:
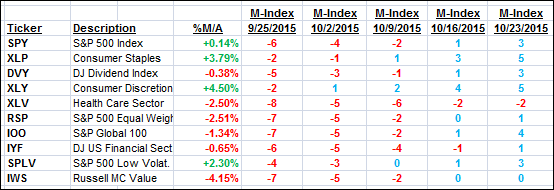
The above table simply demonstrates the magnitude with which some of the ETFs are fluctuating in regards to their positions above or below their respective individual trend lines (%M/A). A break below, represented by a negative number, shows weakness, while a break above, represented by a positive percentage, shows strength.
For hundreds of ETF/Mutual fund choices, be sure to reference Thursday’s StatSheet.
Year to date, here’s how the above candidates have fared so far:
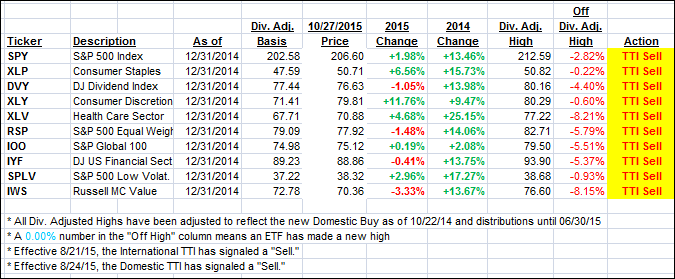
Again, the first table above shows the position of the various ETFs in relation to their respective long term trend lines (%M/A), while the second one tracks their trailing sell stops in the “Off High” column. The “Action” column will signal a “Sell” once the -7.5% point has been taken out in the “Off High” column.
3. Trend Tracking Indexes (TTIs)
Our Domestic Trend Tracking Indexes (TTIs) dropped as the markets pulled back. Domestically, we are now barely staying on the bullish side, so my view remains the same:
I’d like to see a few days of staying power above the line accompanied by a stronger piercing to the upside before issuing a new “Buy” signal for “broadly diversified domestic ETFs/Mutual Funds.”
Here’s how we closed:
Domestic TTI: +0.11% (last close +0.30%)—Sell signal effective 8/24/2015
International TTI: -3.11% (last close -2.54%)—Sell signal effective 8/21/2015
Disclosure: I am obliged to inform you that I, as well as advisory clients of mine, own some of these listed ETFs. Furthermore, they do not represent a specific investment recommendation for you, they merely show which ETFs from the universe I track are falling within the guidelines specified.
Contact Ulli