
1. Moving the Markets
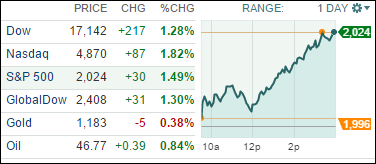
Stocks jumped Thursday, the Nasdaq gaining 1.8% and the Dow climbing 217 points amid mixed profit results from major banks and as less-than-stellar incoming economic data lowered chances of Federal Reserve interest rate hike later this year.
The rebound came a day after shares tumbled sharply after giant retailer Walmart (WMT) warned of a big drop in earnings in its 2017 fiscal year.
Driving the stock action Thursday was an earnings beat by banking giant Citigroup (C), which topped analyst expectations by 3 cents, and a minor miss from Wall Street titan Goldman Sachs (GS), whose earnings came in a penny shy of expectations. Both Citigroup and Goldman Sachs fell shy on revenue.
Wall Street also digested fresh economic data. First-time jobless claims fell 7,000 to 255,000 to a pre-recession low in the latest weekly report, signaling once again that the employment picture is improving. On the inflation front, inflation at the consumer level, or the CPI, fell 0.2% in September, in line with economists’ expectations. The continued low inflation also gives credence to Wall Street’s theory that the Fed will hold off on rate hikes this year.
The question now is will there be enough follow through momentum to generate a new domestic Buy signal? As you can see in section 3, we’re getting close but are not there yet.
In a reversal from yesterday, all of our 10 ETFs in the Spotlight joined the party and closed higher. The leader was Healthcare (XLV) with +2.17%, while Consumer Staples (XLP) and the Dividend ETF (DVY) lagged a little with +0.90%.
2. ETFs in the Spotlight
In case you missed the announcement and description of this section, you can read it here again.
It features 10 broadly diversified ETFs from my HighVolume list as posted every Monday. Furthermore, they are screened for the lowest MaxDD% number meaning they have been showing better resistance to temporary sell offs than all others over the past year.
Here are the 10 candidates:
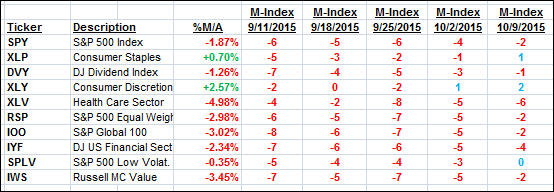
The above table simply demonstrates the magnitude with which some of the ETFs are fluctuating in regards to their positions above or below their respective individual trend lines (%M/A). A break below, represented by a negative number, shows weakness, while a break above, represented by a positive percentage, shows strength.
For hundreds of ETF/Mutual fund choices, be sure to reference Thursday’s StatSheet.
Year to date, here’s how the above candidates have fared so far:
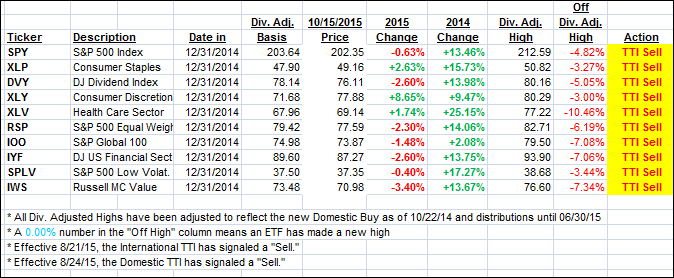
Again, the first table above shows the position of the various ETFs in relation to their respective long term trend lines (%M/A), while the second one tracks their trailing sell stops in the “Off High” column. The “Action” column will signal a “Sell” once the -7.5% point has been taken out in the “Off High” column.
3. Trend Tracking Indexes (TTIs)
Our Trend Tracking Indexes (TTIs) improved with the Domestic one moving closer to a new “Buy” signal. Take a look:
Domestic TTI: -0.46% (last close -1.10%)—Sell signal effective 8/24/2015
International TTI: -3.21% (last close -4.28%)—Sell signal effective 8/21/2015
Until the respective trend lines get clearly broken to the upside, we are staying on the sidelines.
Disclosure: I am obliged to inform you that I, as well as advisory clients of mine, own some of these listed ETFs. Furthermore, they do not represent a specific investment recommendation for you, they merely show which ETFs from the universe I track are falling within the guidelines specified.
Contact Ulli