
1. Moving the Markets
The Fed announced today that it is too soon to raise interest rates and that it will continue to keep its benchmark interest rate between 0% to 0.25%, despite a continuously improving labor market. The Fed could still raise rates when they meet again in October, but analysts speculate that if a hike were to happen it would likely be in December or Q1 of 2016.
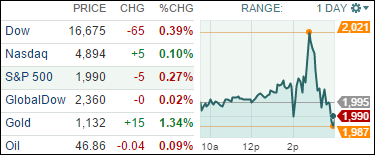
How did today’s decision impact the stock market? Well, it is somewhat hard to tell. Markets have been performing consistently well this week ahead of the decision, however, today both the S&P 500 and Dow dropped slightly, while the Nasdaq gained. Obviously, the lack of clarity on interest rates will send markets back into the “will they or won’t they” mode that has produced much of the volatility we’ve observed throughout 2015.
Crude closed down 25 cents at $46.90 a barrel after surging 5.7% yesterday. The good news for consumers perhaps is that, according to OPEC sources, OPEC forecasts oil prices will allegedly grow by no more than $5 per barrel a year to reach $80 by 2020.
Our 10 ETFs in the Spotlight ended up mixed today with 5 of them gaining and 5 of them losing. On the winning side, Healthcare (XLV) took top billing with +0.91%, while the loser of the day turned out to be the Financials (IYF) with -1.04%.
2. ETFs in the Spotlight
In case you missed the announcement and description of this section, you can read it here again.
It features 10 broadly diversified ETFs from my HighVolume list as posted every Monday. Furthermore, they are screened for the lowest MaxDD% number meaning they have been showing better resistance to temporary sell offs than all others over the past year.
Here are the 10 candidates:
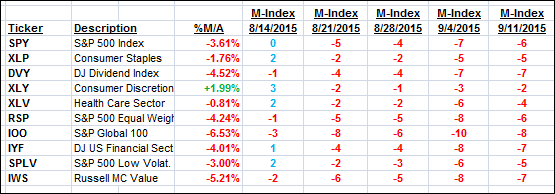
The above table simply demonstrates the magnitude with which some of the ETFs are fluctuating in regards to their positions above or below their respective individual trend lines (%M/A). A break below, represented by a negative number, shows weakness, while a break above, represented by a positive percentage, shows strength.
For hundreds of ETF/Mutual fund choices, be sure to reference Thursday’s StatSheet.
Year to date, here’s how the above candidates have fared so far:
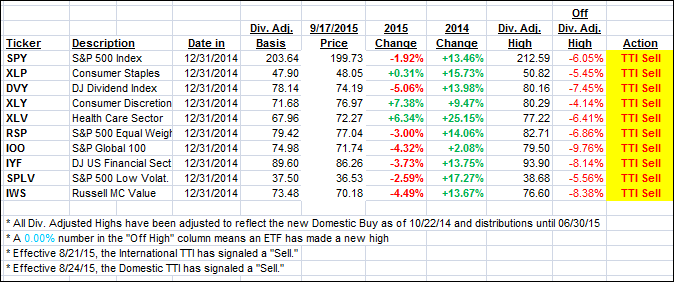
Again, the first table above shows the position of the various ETFs in relation to their respective long term trend lines (%M/A), while the second one tracks their trailing sell stops in the “Off High” column. The “Action” column will signal a “Sell” once the -7.5% point has been taken out in the “Off High” column.
3. Trend Tracking Indexes (TTIs)
Our Trend Tracking Indexes (TTIs) improved slightly but still remain in bearish territory.
Here’s how we closed:
Domestic TTI: -0.90% (last close -1.06%)—Sell signal effective 8/24/2015
International TTI: -3.52% (last close -3.97%)—Sell signal effective 8/21/2015
Until the respective trend lines get clearly broken to the upside, we are staying on the sidelines.
Disclosure: I am obliged to inform you that I, as well as advisory clients of mine, own some of these listed ETFs. Furthermore, they do not represent a specific investment recommendation for you, they merely show which ETFs from the universe I track are falling within the guidelines specified.
Contact Ulli