
1. Moving the Markets
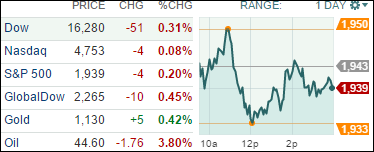
U.S. stocks posted a second straight day of declines but trimmed earlier losses to end only slightly in the red. Stocks have been on a consistent decline since late August, since fears around China’s slowing economy and global growth in general took hold. As you know, according to my Domestic Trend Tracking Index (TTI), we have been in bear market territory effective 8/24/15.
One thing that could turn market sentiment is a fundamental factor in equity valuation, corporate profits. Corporate earnings season for Q3 will begin in early October and Wall Street hopes upcoming earnings reports can break the volatility that markets have been experiencing.
Shares of German automaker Volkswagen (VLKAY), which admitted it used software to cheat on emissions tests, rose about 3% Wednesday, snapping a two-day losing streak. Many investors are showing mixed emotions on where the stock could go, especially given that the CEO Martin Winterkorn announced today that he will be resigning. Volkswagen’s board is expected to appoint a successor on Friday.
And in airline news, Xi JinPing has approved a deal for China to buy 300 Boeing aircraft for $38 billion and build the first aircraft completion plant in that country. The massive Boeing order includes 190 of the 737 model aircraft and 50 wide-body planes for Chinese airlines, and 60 single-aisle planes for leasing companies. China Aviation Supplies Holding Company, ICBC Financial Leasing Co., Ltd., and China Development Bank Leasing with Boeing, will be purchasing the planes.
Our 10 ETFs in the Spotlight presented a mixed picture with 3 of them gaining and 7 of them losing. Leading on the upside were the Financials (IYF) with +0.31%, while on the downside the equal weight ETF (RSP) surrendered -0.42%.
2. ETFs in the Spotlight
In case you missed the announcement and description of this section, you can read it here again.
It features 10 broadly diversified ETFs from my HighVolume list as posted every Monday. Furthermore, they are screened for the lowest MaxDD% number meaning they have been showing better resistance to temporary sell offs than all others over the past year.
Here are the 10 candidates:
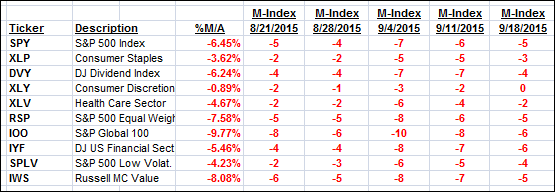
The above table simply demonstrates the magnitude with which some of the ETFs are fluctuating in regards to their positions above or below their respective individual trend lines (%M/A). A break below, represented by a negative number, shows weakness, while a break above, represented by a positive percentage, shows strength.
For hundreds of ETF/Mutual fund choices, be sure to reference Thursday’s StatSheet.
Year to date, here’s how the above candidates have fared so far:
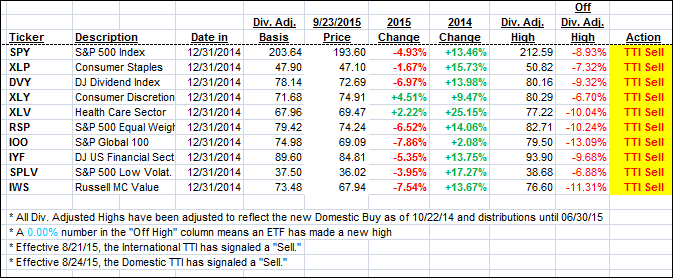
Again, the first table above shows the position of the various ETFs in relation to their respective long term trend lines (%M/A), while the second one tracks their trailing sell stops in the “Off High” column. The “Action” column will signal a “Sell” once the -7.5% point has been taken out in the “Off High” column.
3. Trend Tracking Indexes (TTIs)
Our Trend Tracking Indexes (TTIs) again slipped deeper into bear market territory.
Here’s how we closed:
Domestic TTI: -2.14% (last close -2.01%)—Sell signal effective 8/24/2015
International TTI: -7.08% (last close -6.91%)—Sell signal effective 8/21/2015
Until the respective trend lines get clearly broken to the upside, we are staying on the sidelines.
Disclosure: I am obliged to inform you that I, as well as advisory clients of mine, own some of these listed ETFs. Furthermore, they do not represent a specific investment recommendation for you, they merely show which ETFs from the universe I track are falling within the guidelines specified.
Contact Ulli