
1. Moving the Markets
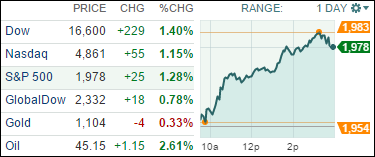
U.S. indexes all gained over 1.10%, just a day ahead of the start to a crucial Federal Reserve policy meeting. Fed policymakers will convene Wednesday and Thursday to decide whether or not to raise interest rates for the first time in close to a decade. Industrial stocks led the pack of gainers today with energy trailing not too far behind.
Would a rate hike push us deeper into the bear market? Not necessarily. In the past six rate-hike cycles dating back to 1983, the S&P 500 stock index declined on the day of the Fed’s first rate increase three times, or 50% of the time. In contrast, stocks jumped 2.3% after the first rate hike in January 1987 and 1.6% following the initial increase in June 1999. The cause for alarm this time around is simply the fact the Fed hasn’t hiked rates in nearly a decade and has kept short-term rates near 0% for so long that investors and markets have become addicted to so-called cheap money. As we all know, a sell-off is a possibility, but the indexes can bounce back just as quickly. We will not get impulsive and let this week play itself out as it may; only after our Domestic TTI signals a new “Buy” will we re-establish new equity positions.
In tech news, we heard a report today from Hewlett-Packard (HP) that the company intends to let go 25,000-30,000 (about 10%) of the company’s total workforce of 302,000 employees, as part of a planned spinoff that will reportedly save the company $2 billion annually. Meg Whitman, H-P CEO, will become CEO of the spinoff Hewlett Packard Enterprise, a company focused on software and services for corporate clients, rather than just printers and PCs. It will trade under the ticker symbol HPE.
All of our 10 ETFs in the Spotlight joined the pre-Fed announcement party and rallied. Leading the pack were the Financials (IYF) with +1.49%; lagging behind was the Low Volatility ETF (SPLV) with +0.83%.
2. ETFs in the Spotlight
In case you missed the announcement and description of this section, you can read it here again.
It features 10 broadly diversified ETFs from my HighVolume list as posted every Monday. Furthermore, they are screened for the lowest MaxDD% number meaning they have been showing better resistance to temporary sell offs than all others over the past year.
Here are the 10 candidates:
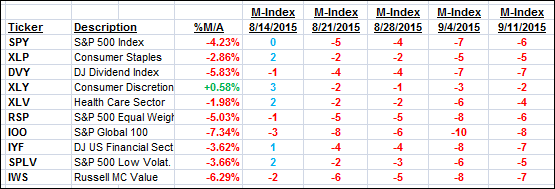
The above table simply demonstrates the magnitude with which some of the ETFs are fluctuating in regards to their positions above or below their respective individual trend lines (%M/A). A break below, represented by a negative number, shows weakness, while a break above, represented by a positive percentage, shows strength.
For hundreds of ETF/Mutual fund choices, be sure to reference Thursday’s StatSheet.
Year to date, here’s how the above candidates have fared so far:
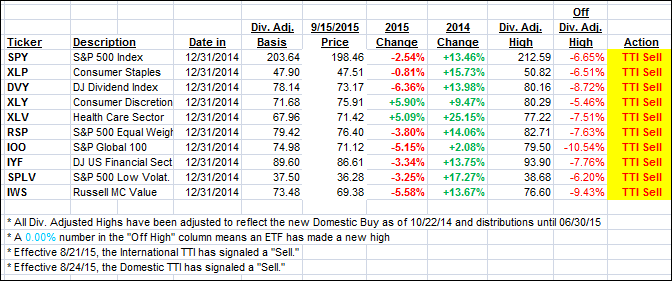
Again, the first table above shows the position of the various ETFs in relation to their respective long term trend lines (%M/A), while the second one tracks their trailing sell stops in the “Off High” column. The “Action” column will signal a “Sell” once the -7.5% point has been taken out in the “Off High” column.
3. Trend Tracking Indexes (TTIs)
Our Trend Tracking Indexes (TTIs) recovered but still remain in bearish territory.
Here’s how we ended up:
Domestic TTI: -1.52% (last close -1.96%)—Sell signal effective 8/24/2015
International TTI: -5.22% (last close -5.77%)—Sell signal effective 8/21/2015
Until the respective trend lines get clearly broken to the upside, we are staying on the sidelines.
Disclosure: I am obliged to inform you that I, as well as advisory clients of mine, own some of these listed ETFs. Furthermore, they do not represent a specific investment recommendation for you, they merely show which ETFs from the universe I track are falling within the guidelines specified.
Contact Ulli