
1. Moving the Markets
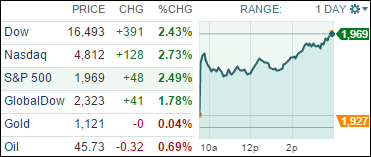
The sharp swings on Wall Street continued Tuesday, with stocks surging as traders returned from the 3-day holiday weekend and sent the Dow up 390 points. The gains came after last week’s volatile downturn that saw all the major indexes drop more than 3%, capped off by the Dow’s 272-point drop on Friday after a mixed jobs data report did little to clarify what the Federal Reserve will do on interest rates at its September meeting. The S&P 500 is now back to where we started this month.
China has been at the forefront of most market volatility of late. Well, today U.S. stocks rallied despite more disappointing economic data from China, because the news sparked hopes that the country’s central bank would take more action to stimulate the economy. The report today showed that China’s imports shrank far more than expected in August, falling for the 10th straight month. This may seem sour on the surface, but in reality it could lead to further policy easing from the Chinese government in coming months. The Chinese government has already intervened to keep their domestic stock markets afloat recently and this could be another time when we see them flex their fiscal muscle if import and export data continues to waver.
In uplifting news today, shares of the beloved U.S. powerhouse General Electric (GE) gained 4% today after the company won European and federal approvals for its $9.5 billion deal to buy French multinational Alstom’s power business. GE initially anticipated the value of the deal to be $13.5 billion; however, the closing purchase price is expected to be around $9.5 billion.
I am curious to see if today turns into another dead cat bounce or if a resumption of the bullish trend is in the making.
Today’s rebound pushed all of our 10 ETFs in the Spotlight higher by a solid margin. The leader of the day was Healthcare (XLV) with +2.80% while Consumer Staples (XLP) lagged a bit but added +2.09%.
2. ETFs in the Spotlight
In case you missed the announcement and description of this section, you can read it here again.
It features 10 broadly diversified ETFs from my HighVolume list as posted every Monday. Furthermore, they are screened for the lowest MaxDD% number meaning they have been showing better resistance to temporary sell offs than all others over the past year.
Here are the 10 candidates:
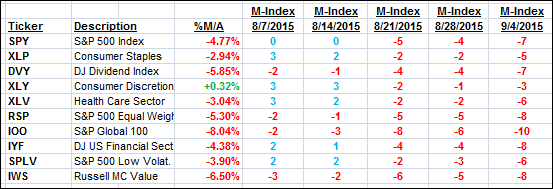
The above table simply demonstrates the magnitude with which some of the ETFs are fluctuating in regards to their positions above or below their respective individual trend lines (%M/A). A break below, represented by a negative number, shows weakness, while a break above, represented by a positive percentage, shows strength.
For hundreds of ETF/Mutual fund choices, be sure to reference Thursday’s StatSheet.
Year to date, here’s how the above candidates have fared so far:
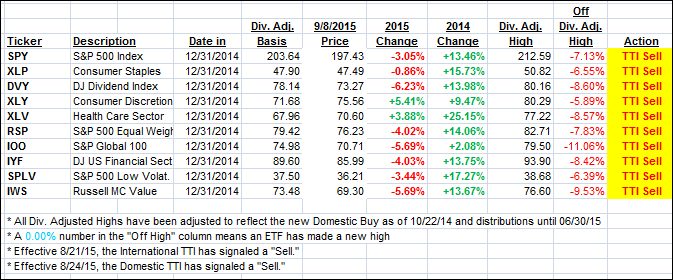
Again, the first table above shows the position of the various ETFs in relation to their respective long term trend lines (%M/A), while the second one tracks their trailing sell stops in the “Off High” column. The “Action” column will signal a “Sell” once the -7.5% point has been taken out in the “Off High” column.
3. Trend Tracking Indexes (TTIs)
Our Trend Tracking Indexes (TTIs) recovered but still remain below their respective trend lines by the following percentages:
Domestic TTI: -1.67% (last close -2.70%)—Sell signal effective 8/24/2015
International TTI: -5.07% (last close -6.89%)—Sell signal effective 8/21/2015
Disclosure: I am obliged to inform you that I, as well as advisory clients of mine, own some of these listed ETFs. Furthermore, they do not represent a specific investment recommendation for you, they merely show which ETFs from the universe I track are falling within the guidelines specified.
Contact Ulli