
ETF/No Load Fund Tracker StatSheet
————————————————————-
THE LINK TO OUR CURRENT ETF/MUTUAL FUND STATSHEET IS:
————————————————————
Market Commentary
INDEXES CONTINUE SLIDING INTO HOLIDAY WEEKEND
1. Moving the Markets
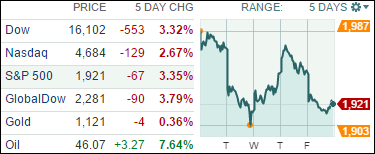
Stocks tumbled on Wall Street as investors reacted to the August jobs report released today. This report is the last monthly employment picture we will receive before the Fed’s key mid-September meeting on interest rates. The report was lackluster, indicating that the U.S. produced less new jobs than expected, but on the flip-side was the lowest reading on the nation’s unemployment rate in more than seven years.
The downturn Friday capped off an ugly week for the markets in which the Dow plunged 3.3%, the S&P 500 fell 3.4% and the Nasdaq lost 2.7%. As bad as the week was, it didn’t come close to what happened just two weeks earlier when the Dow and S&P skidded 5.8% and the Nasdaq tumbled 6.8%.
Reports are saying that today’s reaction suggests investors are betting that the Fed could move to hike rates in two weeks, despite the fact the mixed report provides reason for both a hike and a delay.
Markets will take a breather on Monday to celebrate the Labor Day holiday. It will be interesting to see how the major indexes fare once traders get back in gear come Tuesday morning.
It was another one of those days with no survivors as all of our 10 ETFs in the Spotlight hit the skids and closed lower. It sure felt good to be on the sidelines. Leading the charge to the downside was the Global 100 ETF (IOO) with -2.02%. Holding up best was Consumer Discretionaries (XLY) with only a -1.07% loss.
We remain in bear market territory as section 3 below shows.
2. ETFs in the Spotlight
In case you missed the announcement and description of this section, you can read it here again.
It features 10 broadly diversified ETFs from my HighVolume list as posted every Monday. Furthermore, they are screened for the lowest MaxDD% number meaning they have been showing better resistance to temporary sell offs than all others over the past year.
Here are the 10 candidates:
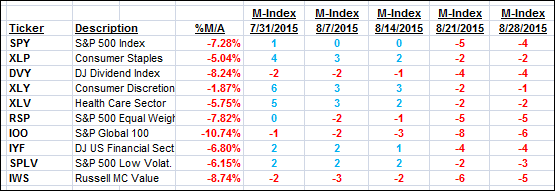
The above table simply demonstrates the magnitude with which some of the ETFs are fluctuating in regards to their positions above or below their respective individual trend lines (%M/A). A break below, represented by a negative number, shows weakness, while a break above, represented by a positive percentage, shows strength.
For hundreds of ETF/Mutual fund choices, be sure to reference Thursday’s StatSheet.
Year to date, here’s how the above candidates have fared so far:
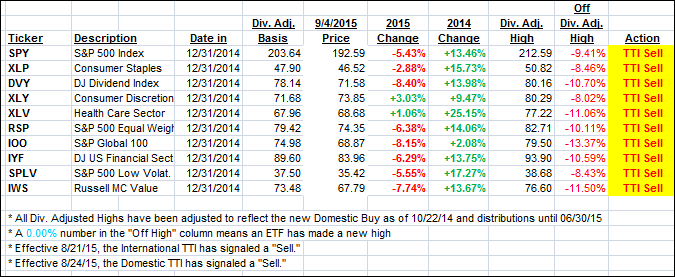
Again, the first table above shows the position of the various ETFs in relation to their respective long term trend lines (%M/A), while the second one tracks their trailing sell stops in the “Off High” column. The “Action” column will signal a “Sell” once the -7.5% point has been taken out in the “Off High” column.
3. Trend Tracking Indexes (TTIs)
Our Trend Tracking Indexes (TTIs) headed further below their respective trend lines confirming our bearish stance on equities. Here’s how we ended the week:
Domestic TTI: -2.70% (last Friday -1.40%)—Sell signal effective 8/24/2015
International TTI: -6.89% (last Friday -4.11%)—Sell signal effective 8/21/2015
Until the respective trend lines get clearly broken to the upside, we are staying on the sidelines.
Have a great Labor Day weekend.
Ulli…
Disclosure: I am obliged to inform you that I, as well as advisory clients of mine, own some of these listed ETFs. Furthermore, they do not represent a specific investment recommendation for you, they merely show which ETFs from the universe I track are falling within the guidelines specified.
————————————————————-
READER Q & A FOR THE WEEK
Reader Kathy:
Q: Ulli: I was wondering what you thought of the market fluctuation this week when many of the ETF’s had a meltdown inconsistent with their underlying securities. FOX Business news had been covering it all week. It may not have affected investors who follow your sell signals because you triggered that on Friday, but it could have occurred in the days leading up to your sell signal.
Many small investors who had stop loss on their ETF, lost a ton of $$ because their sell stops triggered. By the end of the day, those prices rebounded and by the end of the week, many investors had substantial losses because of this. Makes me want to think about individual stocks again! ETF’s seemed to be the answer to not using mutual funds because they could not be traded during the trading day. But now, I wonder!
If you addressed this, I missed it—sorry!
A: Kathy: Actually, the big drop and the meltdown occurred after our “Sell” signal. However, this is nothing new and one of the reasons why I never put in sell orders ahead of time but use day-ending prices only to make my decisions. I then enter the order the next day as a “limit” order; never ever as a market order!
It avoids a lot of headaches, as I posted back in 2009 in “Front Runners.”
This is an old issue that gets put on the front burner every time the markets hiccup.
All Reader Q & A’s are listed at our web site!
Check it out at:
https://theetfbully.com/questions-answers/
———————————————————-
WOULD YOU LIKE TO HAVE YOUR INVESTMENTS PROFESSIONALLY MANAGED?
Do you have the time to follow our investment plans yourself? If you are a busy professional who would like to have his portfolio managed using our methodology, please contact me directly or get more details at:
https://theetfbully.com/personal-investment-management/
———————————————————
Back issues of the ETF/No Load Fund Tracker are available on the web at:
https://theetfbully.com/newsletter-archives/
Contact Ulli