
ETF/No Load Fund Tracker StatSheet
————————————————————-
THE LINK TO OUR CURRENT ETF/MUTUAL FUND STATSHEET IS:
————————————————————
Market Commentary
STOCKS AND OIL TAKE A BATH TO CLOSE THE WEEK
1. Moving the Markets
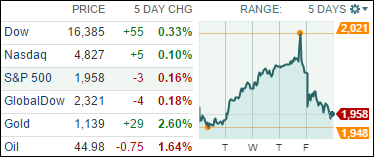
Markets climbed from the beginning of the week up until the Federal Open Market Committee (FOMC) made its decision to keep the fed funds rate between 0.0% and 0.25% Thursday, which caused stocks to stumble into Thursday’s close and post further losses on Friday. Oil prices also fell today by more than 4% as U.S. benchmark crude dropped to about $45 a barrel.
The major indexes here in the U.S. fell more than 1.3% Friday as investors focused on the Fed’s worries about recent turbulence in financial markets and the health of the global economy. All 10 of the S&P 500 sectors ended lower today, with energy stocks leading the dive. On the week, major indexes were lower with the utilities sector showing relative strength and the materials sector showing relative weakness.
Looking ahead to next week’s key economic numbers, investors will focus on existing home sales on Monday, the Purchasing Managers’ Manufacturing Index (PMI) on Wednesday, and durable goods orders on Thursday. Additionally, Wall Street will take note of the University of Michigan’s Consumer Sentiment data that will be released on Friday.
All of our 10 ETFs in the Spotlight reversed and headed south after gaining earlier in the week. Scoring the worst was the S&P 500 (SPY) with -2.17% while the Select Dividend ETF (DVY) held up best by giving back only -1.33%.
2. ETFs in the Spotlight
In case you missed the announcement and description of this section, you can read it here again.
It features 10 broadly diversified ETFs from my HighVolume list as posted every Monday. Furthermore, they are screened for the lowest MaxDD% number meaning they have been showing better resistance to temporary sell offs than all others over the past year.
Here are the 10 candidates:
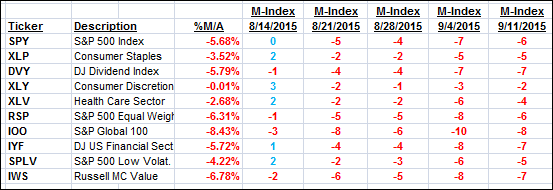
The above table simply demonstrates the magnitude with which some of the ETFs are fluctuating in regards to their positions above or below their respective individual trend lines (%M/A). A break below, represented by a negative number, shows weakness, while a break above, represented by a positive percentage, shows strength.
For hundreds of ETF/Mutual fund choices, be sure to reference Thursday’s StatSheet.
Year to date, here’s how the above candidates have fared so far:
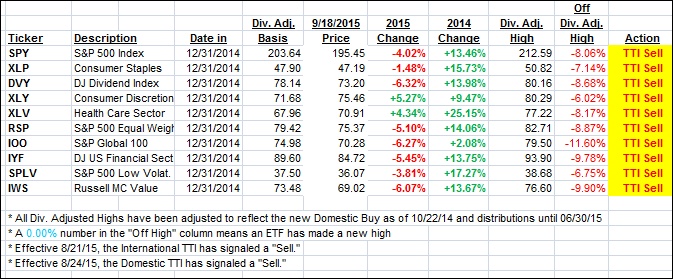
Again, the first table above shows the position of the various ETFs in relation to their respective long term trend lines (%M/A), while the second one tracks their trailing sell stops in the “Off High” column. The “Action” column will signal a “Sell” once the -7.5% point has been taken out in the “Off High” column.
3. Trend Tracking Indexes (TTIs)
Our Trend Tracking Indexes (TTIs) improved from last week, but we’re still stuck in bear market territory by the following percentages:
Domestic TTI: -1.49% (last Friday -2.70%)—Sell signal effective 8/24/2015
International TTI: -5.14% (last Friday -6.89%)—Sell signal effective 8/21/2015
Until the respective trend lines get clearly broken to the upside, we are staying on the sidelines.
Have a great weekend.
Ulli…
Disclosure: I am obliged to inform you that I, as well as advisory clients of mine, own some of these listed ETFs. Furthermore, they do not represent a specific investment recommendation for you, they merely show which ETFs from the universe I track are falling within the guidelines specified.
————————————————————-
READER Q & A FOR THE WEEK
Reader Don:
Q: Ulli: Thanks again for all the info you provide. Since no one knows if this is short-term correction or the beginning of a bear market we all depend on your expertise to guide us.
When a buy signal is triggered, will you use the same ETFs that you were using in your portfolio or will you use the M-Index to determine if some or all should be replaced at that time?
Also, do you invest in equal amounts in each ETF? I would think that would be the proper way since you are not trying to diversify the portfolio.
Thank you for your time all the info you give us.
A: Don: It all depends when the next Buy signal is triggered. If it happens fairly fast, such as it did last October, I used the same ETFs we owned before. If, on the other hand, we sink deeper into this bear market, and some time passes, I will re-evaluate and consult my High Volume ETF list at that time.
As far as individual allocation is concerned, I sometimes have favorites, so I don’t necessarily invest equal amounts. For example, during the last Buy cycle we had a larger allocation to Healthcare, which performed very well and helped average out the performance of those ETFs that were less than stellar.
All Reader Q & A’s are listed at our web site!
Check it out at:
https://theetfbully.com/questions-answers/
———————————————————-
WOULD YOU LIKE TO HAVE YOUR INVESTMENTS PROFESSIONALLY MANAGED?
Do you have the time to follow our investment plans yourself? If you are a busy professional who would like to have his portfolio managed using our methodology, please contact me directly or get more details at:
https://theetfbully.com/personal-investment-management/
———————————————————
Back issues of the ETF/No Load Fund Tracker are available on the web at:
https://theetfbully.com/newsletter-archives/
Contact Ulli