
1. Moving the Markets
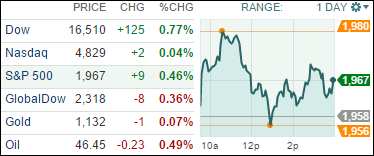
Stocks climbed Monday, the Nasdaq just barely, in a seesaw day as Wall Street shook off a two-day slump that was sparked by last week’s decision by the Federal Reserve not to raise interest rates. Crude Oil gained slightly today as well to close at $46.69 a barrel.
In M&A news, Chipmaker Atmel (ATML) jumped after accepting a bid from Britain’s Dialog Semiconductor. Amtel’s business is the manufacturing and sale of electronics used in Internet of Things products, automobiles, computers and other consumer communications.
In other tech news, there was some controversy surrounding Apple (AAPL) today when the public found out that some 39 apps in the app store became infected over the weekend. The malicious code is called Xcode Ghost and came hidden in a fake version of Xcode, popular Apple software used to create applications. Most apple representatives are only calling it a minor setback as the company unveils its new line of iPhones. Some other rumors emerged today though regarding Apple potentially unveiling a smart car in 2019. The rumor is that Apple currently has a team of 600 working on the project.
9 of our 10 ETFs in the Spotlight managed to climb higher during this whip-saw day with the leader being the Financials (IYF) with +1.13%. On the losing side, Healthcare (XLV) stood out by surrendering -1.38%.
2. ETFs in the Spotlight
In case you missed the announcement and description of this section, you can read it here again.
It features 10 broadly diversified ETFs from my HighVolume list as posted every Monday. Furthermore, they are screened for the lowest MaxDD% number meaning they have been showing better resistance to temporary sell offs than all others over the past year.
Here are the 10 candidates:
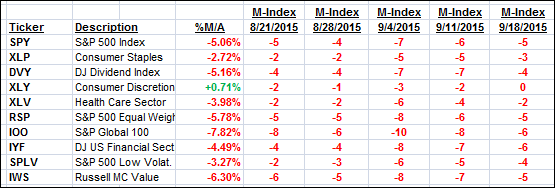
The above table simply demonstrates the magnitude with which some of the ETFs are fluctuating in regards to their positions above or below their respective individual trend lines (%M/A). A break below, represented by a negative number, shows weakness, while a break above, represented by a positive percentage, shows strength.
For hundreds of ETF/Mutual fund choices, be sure to reference Thursday’s StatSheet.
Year to date, here’s how the above candidates have fared so far:
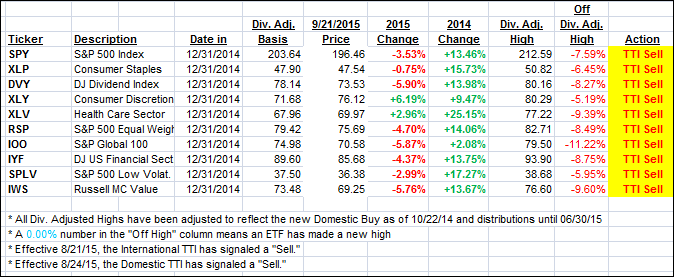
Again, the first table above shows the position of the various ETFs in relation to their respective long term trend lines (%M/A), while the second one tracks their trailing sell stops in the “Off High” column. The “Action” column will signal a “Sell” once the -7.5% point has been taken out in the “Off High” column.
3. Trend Tracking Indexes (TTIs)
Our Trend Tracking Indexes (TTIs) barely budged from the previous close:
Domestic TTI: -1.48% (last close -1.49%)—Sell signal effective 8/24/2015
International TTI: -5.25% (last close -5.14%)—Sell signal effective 8/21/2015
Until the respective trend lines get clearly broken to the upside, we are staying on the sidelines.
Disclosure: I am obliged to inform you that I, as well as advisory clients of mine, own some of these listed ETFs. Furthermore, they do not represent a specific investment recommendation for you, they merely show which ETFs from the universe I track are falling within the guidelines specified.
Contact Ulli