
1. Moving the Markets
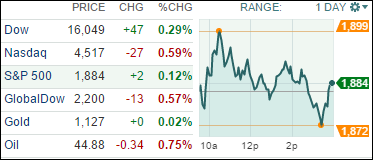
Stocks ended in mixed territory after choppy trading as Wall Street staged a partial rebound from Monday’s sharp sell-off that edged the U.S. market closer to its 2015 lows hit in late August. The S&P 500 and Dow both stayed in positive territory, while the Nasdaq slipped further into the red.
Markets were steadied today by a rebound in healthcare stocks. Pharmaceutical companies Biogen (BIIB) and Vertex (VRTX) notched the largest gainers on the day. Drug manufacturer stocks have been weak recently due to concerns that new legislation will introduce price controls throughout the industry.
We also heard some favorable news on the economy today from a report that showed consumers grew more confident in September despite increased market volatility. The September reading on consumer confidence rose to 103, which is the highest since January.
Finally, 8 of our 10 ETFs in the Spotlight showed some green numbers for a change with the leader of the day being yesterday’s big loser, namely Healthcare (XLV), with +0.92%. On the downside, Consumer Discretionaries (XLY) was the weakest with -0.33%.
2. ETFs in the Spotlight
In case you missed the announcement and description of this section, you can read it here again.
It features 10 broadly diversified ETFs from my HighVolume list as posted every Monday. Furthermore, they are screened for the lowest MaxDD% number meaning they have been showing better resistance to temporary sell offs than all others over the past year.
Here are the 10 candidates:
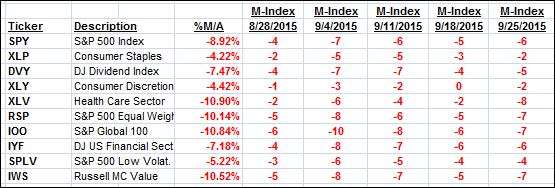
The above table simply demonstrates the magnitude with which some of the ETFs are fluctuating in regards to their positions above or below their respective individual trend lines (%M/A). A break below, represented by a negative number, shows weakness, while a break above, represented by a positive percentage, shows strength.
For hundreds of ETF/Mutual fund choices, be sure to reference Thursday’s StatSheet.
Year to date, here’s how the above candidates have fared so far:
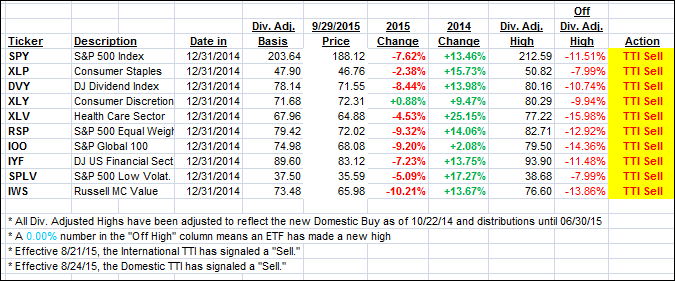
Again, the first table above shows the position of the various ETFs in relation to their respective long term trend lines (%M/A), while the second one tracks their trailing sell stops in the “Off High” column. The “Action” column will signal a “Sell” once the -7.5% point has been taken out in the “Off High” column.
3. Trend Tracking Indexes (TTIs)
Our Trend Tracking Indexes (TTIs) continued to head south although today’s move was fairly minor as the table shows:
Domestic TTI: -3.63% (last close -3.61%)—Sell signal effective 8/24/2015
International TTI: -10.10% (last close -9.74%)—Sell signal effective 8/21/2015
Until the respective trend lines get clearly broken to the upside, we are staying on the sidelines.
Disclosure: I am obliged to inform you that I, as well as advisory clients of mine, own some of these listed ETFs. Furthermore, they do not represent a specific investment recommendation for you, they merely show which ETFs from the universe I track are falling within the guidelines specified.
Contact Ulli