
1. Moving the Markets
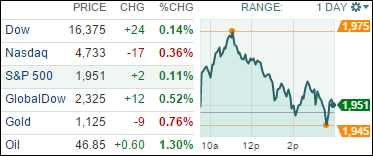
Equities closed mixed today as an early rally on Wall Street slowly faded and gave back strong gains. Stocks jumped early in the trading session after yesterday’s big rebound, as Wall Street digested favorable data on the services sector of the U.S. economy and reassuring comments from the European Central Bank. It seems though that investors are remaining cautious in anticipation of a key reading on U.S. employment that will be released tomorrow.
A lot is riding on this employment report, as a very strong report could give the Fed further ammunition to raise short-term interest rates for the first time in nearly a decade. Despite warnings from the IMF that the Fed should hold off on hiking rates, a continuation of good economic data in the U.S. will make the Fed’s decision that much more difficult.
In the tech world, Apple (AAPL) fans and investors both are gearing up for an Apple product unveiling next week. Most speculate that the unveiling will entail a new iPhone model, possible the 6S and 6S Plus. According to FactSet, analysts expect Apple will sell about 235 million iPhones in its upcoming fiscal year, which starts in October, up from 231 million in the prior year.
As you know, according to my Trend Tracking Indicators (TTIs), we are stuck in bear market territory and therefore positioned safely on the the sidelines. There are a variety of ways to determine a bear market and, one of my favorite writers, David Stockman, makes a case that “This Is Not A Retest—It’s A Live Bear!” It’s a great read.
9 of our 10 ETFs in the Spotlight were able to post gains in light of this roller coaster day. Taking top billing was Consumer Staples (XLP) with +0.68% while Healthcare (XLV) lagged with -0.71%.
2. ETFs in the Spotlight
In case you missed the announcement and description of this section, you can read it here again.
It features 10 broadly diversified ETFs from my HighVolume list as posted every Monday. Furthermore, they are screened for the lowest MaxDD% number meaning they have been showing better resistance to temporary sell offs than all others over the past year.
Here are the 10 candidates:
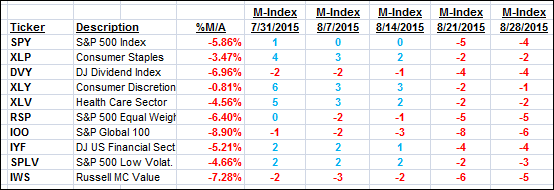
The above table simply demonstrates the magnitude with which some of the ETFs are fluctuating in regards to their positions above or below their respective individual trend lines (%M/A). A break below, represented by a negative number, shows weakness, while a break above, represented by a positive percentage, shows strength.
For hundreds of ETF/Mutual fund choices, be sure to reference Thursday’s StatSheet.
Year to date, here’s how the above candidates have fared so far:
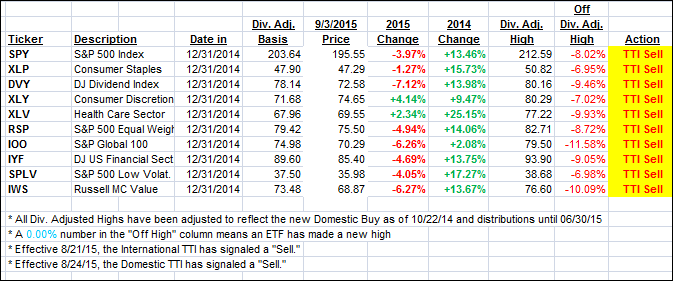
Again, the first table above shows the position of the various ETFs in relation to their respective long term trend lines (%M/A), while the second one tracks their trailing sell stops in the “Off High” column. The “Action” column will signal a “Sell” once the -7.5% point has been taken out in the “Off High” column.
3. Trend Tracking Indexes (TTIs)
Both of our Trend Tracking Indexes (TTIs) slipped a tad but remain bearish:
Here’s how we ended up:
Domestic TTI: -2.22% (last close -2.33%)—Sell signal effective 8/24/2015
International TTI: -5.78% (last close -6.00%)—Sell signal effective 8/21/2015
Disclosure: I am obliged to inform you that I, as well as advisory clients of mine, own some of these listed ETFs. Furthermore, they do not represent a specific investment recommendation for you, they merely show which ETFs from the universe I track are falling within the guidelines specified.
Contact Ulli