
1. Moving the Markets
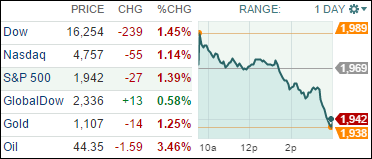
An early rally on Wall Street faded as stocks gave back all of their gains and fell hard — with the Dow plunging more than 200 points as it finished on the losing end of a 411-point swing. Stocks initially surged at the open and followed a major move higher in Japan, where Tokyo stocks had their biggest one-day percentage gain since 2008.
The swing came back to us here in the U.S. when we received a report that showed job openings in the U.S. hit a record high in July. The jobs report suggests that a tightening in the labor market, but at the same time raised concerns that the Federal Reserve could raise interest rates at its policy meeting next week.
All the news in tech today centered on Apple’s (AAPL) expo. In a two-hour press event that made numerous nods to the enterprise market and the benefits of viewing video and game content on bigger digital displays, Apple stressed the bottom line. Essentially stating that it has every intention of milking the iPhone juggernaut for the foreseeable future. Apple unveiled new iPhones that have a ‘force-touch’ technology and pitched their re-imagined iPad, which was vouched for by a Microsoft executive onstage.
It was a reversal from yesterday as the roller-coaster ride continued pulling all of our 10 ETFs in the Spotlight down a slippery slope. Showing the most bearish momentum was Consumer Staples (XLP) with -1.64% while the Discretionaries (XLY) held up best by losing only -1.05%.
We remain in bear market territory.
2. ETFs in the Spotlight
In case you missed the announcement and description of this section, you can read it here again.
It features 10 broadly diversified ETFs from my HighVolume list as posted every Monday. Furthermore, they are screened for the lowest MaxDD% number meaning they have been showing better resistance to temporary sell offs than all others over the past year.
Here are the 10 candidates:
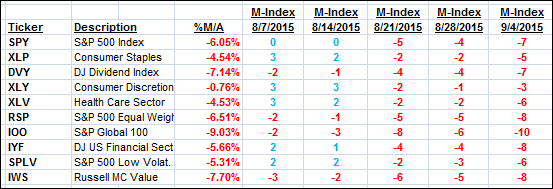
The above table simply demonstrates the magnitude with which some of the ETFs are fluctuating in regards to their positions above or below their respective individual trend lines (%M/A). A break below, represented by a negative number, shows weakness, while a break above, represented by a positive percentage, shows strength.
For hundreds of ETF/Mutual fund choices, be sure to reference Thursday’s StatSheet.
Year to date, here’s how the above candidates have fared so far:
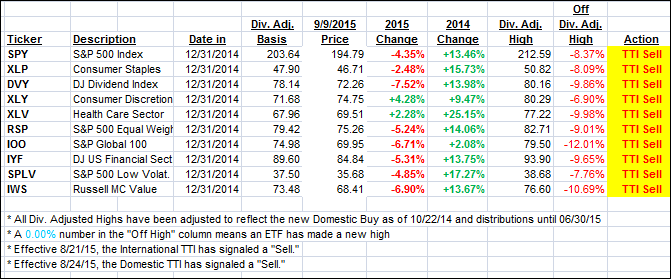
Again, the first table above shows the position of the various ETFs in relation to their respective long term trend lines (%M/A), while the second one tracks their trailing sell stops in the “Off High” column. The “Action” column will signal a “Sell” once the -7.5% point has been taken out in the “Off High” column.
3. Trend Tracking Indexes (TTIs)
Our Trend Tracking Indexes (TTIs) reversed and crawled deeper into bearish territory. Here’s how we ended up:
Domestic TTI: -2.24% (last close -1.67%)—Sell signal effective 8/24/2015
International TTI: -5.44% (last close -5.07%)—Sell signal effective 8/21/2015
Disclosure: I am obliged to inform you that I, as well as advisory clients of mine, own some of these listed ETFs. Furthermore, they do not represent a specific investment recommendation for you, they merely show which ETFs from the universe I track are falling within the guidelines specified.
Contact Ulli